

404
F1
0.1r-.....=:~.....:°T·0:.....:-=;0.2:........::0r..4...,.....;O';:II~.,
O.
-1.0
.....
~'
• ~~.~ I)
.. . . .
. :: ..
. i:.' ..
ph1-1. . ....
.. . ...
. . :.. .
•••
I
.....
..... -
, ... ,.
:S .... ~ :.:
; ....... : Ph"i2··
.. : , ....
..
.
t -.
·2._Q1.-=-0 ~-_-f1.-::-0 ~---:!-.0.0:--~7:1.0:--~-;!2.0·
F1
DiZhou
F3
(b)
0.2
0.1
lWa-o.u!Yf---;O.O lf.
F3
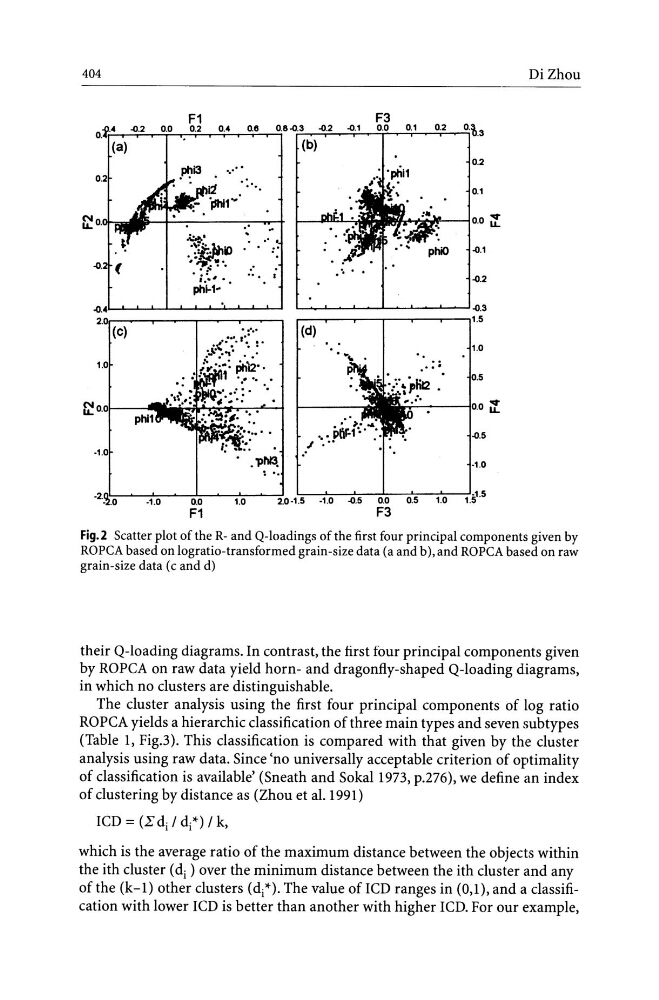
Fig.2 Scatter plot of the R- and Q-Ioadings ofthe first four principal components given by
ROPCA based on logratio-transformed grain-size data (a and b),and ROPCA based on raw
grain-size data (c and d)
their Q-Ioading diagrams. In contrast, the first four principal components given
by ROPCA on raw data yield horn- and dragonfly-shaped Q-Ioading diagrams,
in which no clusters are distinguishable.
The cluster analysis using the first four principal components of log ratio
ROPCA yields a hierarchic classification of three main types and seven subtypes
(Table 1, Fig.3). This classification is compared with that given by the cluster
analysis using raw data. Since 'no universally acceptable criterion of optimality
of classification is available' (Sneath and Soka11973, p.276), we define an index
of clustering by distance as (Zhou et al.1991)
ICD = (.Edil dt) / k,
which is the average ratio of the maximum distance between the objects within
the ith cluster (d i ) over the minimum distance between the ith cluster and any
of the (k-1) other clusters (dt). The value of ICD ranges in (0,1), and a classification with lower ICD is better than another with higher ICD. For our example,
F1
0.1r-.....=:~.....:°T·0:.....:-=;0.2:........::0r..4...,.....;O';:II~.,
O.
-1.0
.....
~'
• ~~.~ I)
.. . . .
. :: ..
. i:.' ..
ph1-1. . ....
.. . ...
. . :.. .
•••
I
.....
..... -
, ... ,.
:S .... ~ :.:
; ....... : Ph"i2··
.. : , ....
..
.
t -.
·2._Q1.-=-0 ~-_-f1.-::-0 ~---:!-.0.0:--~7:1.0:--~-;!2.0·
F1
DiZhou
F3
(b)
0.2
0.1
lWa-o.u!Yf---;O.O lf.
F3
Fig.2 Scatter plot of the R- and Q-Ioadings ofthe first four principal components given by
ROPCA based on logratio-transformed grain-size data (a and b),and ROPCA based on raw
grain-size data (c and d)
their Q-Ioading diagrams. In contrast, the first four principal components given
by ROPCA on raw data yield horn- and dragonfly-shaped Q-Ioading diagrams,
in which no clusters are distinguishable.
The cluster analysis using the first four principal components of log ratio
ROPCA yields a hierarchic classification of three main types and seven subtypes
(Table 1, Fig.3). This classification is compared with that given by the cluster
analysis using raw data. Since 'no universally acceptable criterion of optimality
of classification is available' (Sneath and Soka11973, p.276), we define an index
of clustering by distance as (Zhou et al.1991)
ICD = (.Edil dt) / k,
which is the average ratio of the maximum distance between the objects within
the ith cluster (d i ) over the minimum distance between the ith cluster and any
of the (k-1) other clusters (dt). The value of ICD ranges in (0,1), and a classification with lower ICD is better than another with higher ICD. For our example,