

Classification of Compositional Data Using Mixture Models: a Case Study Using Granulometric Data 399
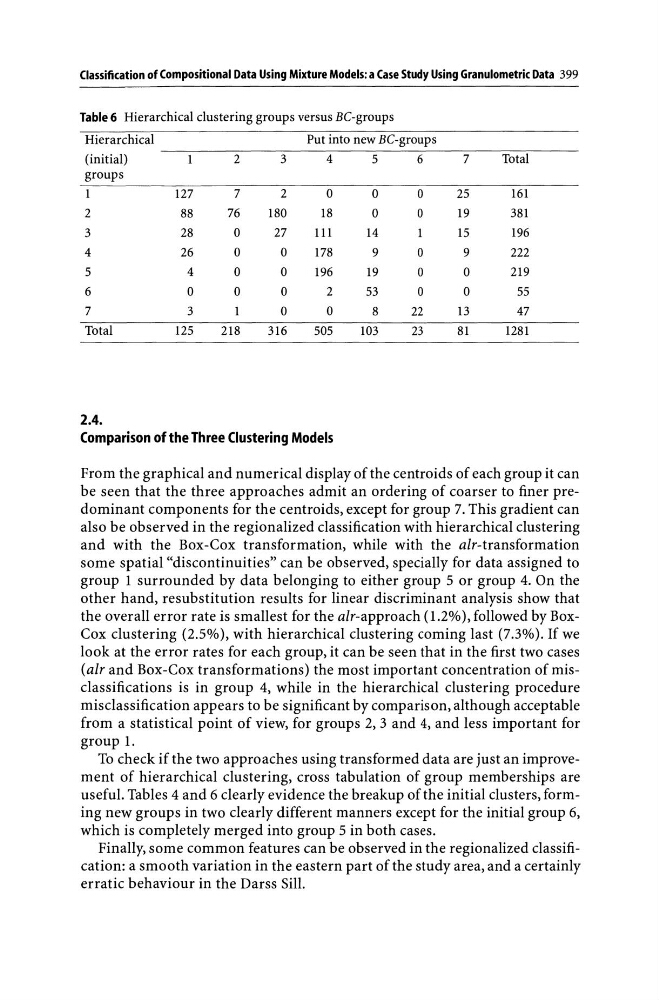
Table 6 Hierarchical clustering groups versus BC-groups
Hierarchical
Put into new BC-groups
(initial)
2
3
4
5
6
7
Total
groups
1
127
7
2
0
0
0
25
161
2
88
76
180
18
0
0
19
381
3
28
0
27
111
14
1
15
196
4
26
0
0
178
9
0
9
222
5
4
0
0
196
19
0
0
219
6
0
0
0
2
53
0
0
55
7
3
0
0
8
22
13
47
Total
125
218
316
505
103
23
81
1281
2.4.
Comparison of the Three Clustering Models
From the graphical and numerical display of the centroids of each group it can
be seen that the three approaches admit an ordering of coarser to finer predominant components for the centroids, except for group 7. This gradient can
also be observed in the regionalized classification with hierarchical clustering
and with the Box-Cox transformation, while with the air-transformation
some spatial "discontinuities" can be observed, specially for data assigned to
group 1 surrounded by data belonging to either group 5 or group 4. On the
other hand, resubstitution results for linear discriminant analysis show that
the overall error rate is smallest for the air-approach (1.2%), followed by BoxCox clustering (2.5%), with hierarchical clustering coming last (7.3%). If we
look at the error rates for each group, it can be seen that in the first two cases
(air and Box-Cox transformations) the most important concentration of misclassifications is in group 4, while in the hierarchical clustering procedure
misclassification appears to be significant by comparison, although acceptable
from a statistical point of view, for groups 2, 3 and 4, and less important for
group 1.
To check if the two approaches using transformed data are just an improvement of hierarchical clustering, cross tabulation of group memberships are
useful. Tables 4 and 6 clearly evidence the breakup of the initial clusters, forming new groups in two clearly different manners except for the initial group 6,
which is completely merged into group 5 in both cases.
Finally, some common features can be observed in the regionalized classification: a smooth variation in the eastern part of the study area, and a certainly
erratic behaviour in the Darss Sill.
Table 6 Hierarchical clustering groups versus BC-groups
Hierarchical
Put into new BC-groups
(initial)
2
3
4
5
6
7
Total
groups
1
127
7
2
0
0
0
25
161
2
88
76
180
18
0
0
19
381
3
28
0
27
111
14
1
15
196
4
26
0
0
178
9
0
9
222
5
4
0
0
196
19
0
0
219
6
0
0
0
2
53
0
0
55
7
3
0
0
8
22
13
47
Total
125
218
316
505
103
23
81
1281
2.4.
Comparison of the Three Clustering Models
From the graphical and numerical display of the centroids of each group it can
be seen that the three approaches admit an ordering of coarser to finer predominant components for the centroids, except for group 7. This gradient can
also be observed in the regionalized classification with hierarchical clustering
and with the Box-Cox transformation, while with the air-transformation
some spatial "discontinuities" can be observed, specially for data assigned to
group 1 surrounded by data belonging to either group 5 or group 4. On the
other hand, resubstitution results for linear discriminant analysis show that
the overall error rate is smallest for the air-approach (1.2%), followed by BoxCox clustering (2.5%), with hierarchical clustering coming last (7.3%). If we
look at the error rates for each group, it can be seen that in the first two cases
(air and Box-Cox transformations) the most important concentration of misclassifications is in group 4, while in the hierarchical clustering procedure
misclassification appears to be significant by comparison, although acceptable
from a statistical point of view, for groups 2, 3 and 4, and less important for
group 1.
To check if the two approaches using transformed data are just an improvement of hierarchical clustering, cross tabulation of group memberships are
useful. Tables 4 and 6 clearly evidence the breakup of the initial clusters, forming new groups in two clearly different manners except for the initial group 6,
which is completely merged into group 5 in both cases.
Finally, some common features can be observed in the regionalized classification: a smooth variation in the eastern part of the study area, and a certainly
erratic behaviour in the Darss Sill.