

382
I. Gustavs
6
Application of the Physical-Sedimentological Model
The set of measured porosities at the sediment surface in the Arkona Basin includes 64 locations (white squares in Fig. 2). To achieve a higher resolution in
lateral direction before creating a regional model, we increase the number of
data points by porosity modeling. One can add 302 measurements by considering the row data base (gray squares in Fig. 2). This resulted in a significant densification in the data coverage, especially in the southern part of the study area.
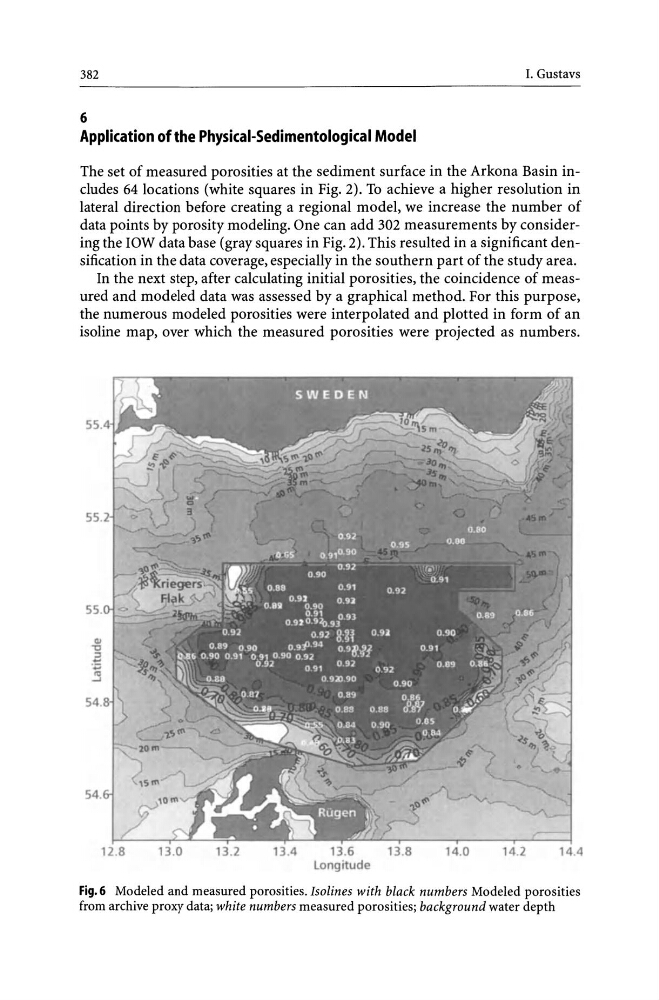
In the next step, after calculating initial porosities, the coincidence of measured and modeled data was assessed by a graphical method. For this purpose,
the numerous modeled porosities were interpolated and plotted in form of an
isoline map, over which the measured porosities were projected as numbers.
12 .8
13 .0
13 .2
13.4
13.6
Longitude
13 .8
14.0
14.2
14.4
Fig.6 Modeled and measured porosities. Isolines with black numbers Modeled porosities
from archive proxy data; white numbers measured porosities; background water depth
I. Gustavs
6
Application of the Physical-Sedimentological Model
The set of measured porosities at the sediment surface in the Arkona Basin includes 64 locations (white squares in Fig. 2). To achieve a higher resolution in
lateral direction before creating a regional model, we increase the number of
data points by porosity modeling. One can add 302 measurements by considering the row data base (gray squares in Fig. 2). This resulted in a significant densification in the data coverage, especially in the southern part of the study area.
In the next step, after calculating initial porosities, the coincidence of measured and modeled data was assessed by a graphical method. For this purpose,
the numerous modeled porosities were interpolated and plotted in form of an
isoline map, over which the measured porosities were projected as numbers.
12 .8
13 .0
13 .2
13.4
13.6
Longitude
13 .8
14.0
14.2
14.4
Fig.6 Modeled and measured porosities. Isolines with black numbers Modeled porosities
from archive proxy data; white numbers measured porosities; background water depth