

266
m
o
Well No. 1
Well No. 2
Well No, 3
Well No. 4
m
o
I
· · · · · · I"
. . . . . . . . . . . . . . . . I;~5 . . . I················ I
12;;/
500
500
1000
Well No.1
m
o
I
Well No.2
Well No. 3
....
1'205
=
I .............. I "i6' ........ I
500
I
1000
I 1000
Well No.4
I
m
o
500
I 1000
EP. Agterberg . EM. Gradstein
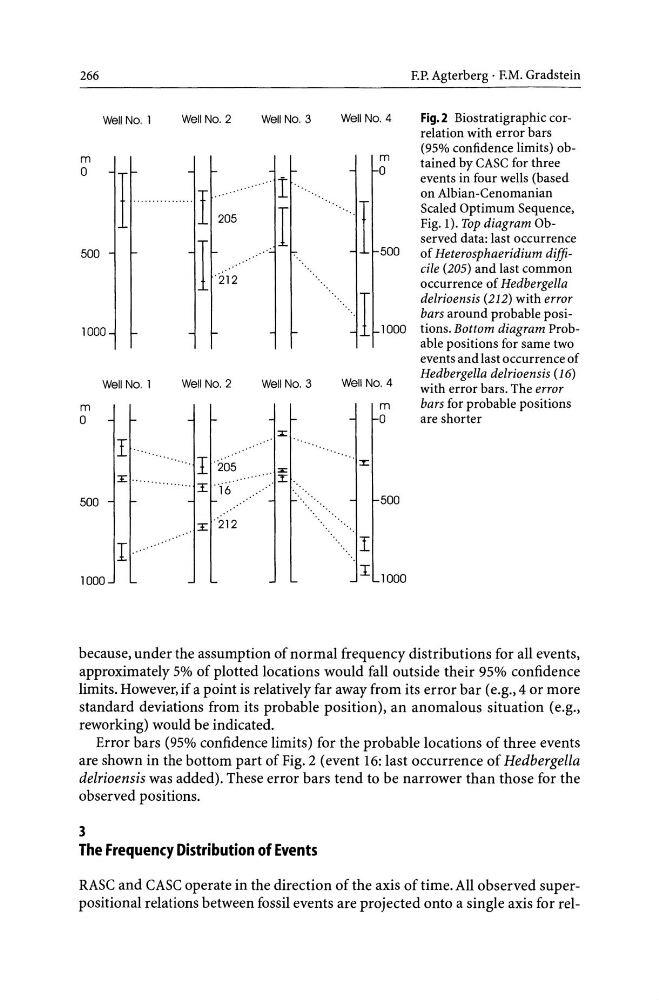
Fig.2 Biostratigraphic correlation with error bars
(95% confidence limits) obtained by CASC for three
events in four wells (based
on Albian-Cenomanian
Scaled Optimum Sequence,
Fig. 1). Top diagram Observed data: last occurrence
of Heterosphaeridium difficile (205) and last common
occurrence of Hedbergella
delrioensis (212) with error
bars around probable positions. Bottom diagram Probable positions for same two
events and last occurrence of
Hedbergella delrioensis (16)
with error bars. The error
bars for probable positions
are shorter
because, under the assumption of normal frequency distributions for all events,
approximately 5% of plotted locations would fall outside their 95% confidence
limits. However, if a point is relatively far away from its error bar (e.g., 4 or more
standard deviations from its probable position), an anomalous situation (e.g.,
reworking) would be indicated.
Error bars (95% confidence limits) for the probable locations of three events
are shown in the bottom part of Fig. 2 (event 16: last occurrence of Hedbergella
delrioensis was added). These error bars tend to be narrower than those for the
observed positions.
3
The Frequency Distribution of Events
RAse and eAse operate in the direction of the axis of time. All observed superpositional relations between fossil events are projected onto a single axis for rel-
m
o
Well No. 1
Well No. 2
Well No, 3
Well No. 4
m
o
I
· · · · · · I"
. . . . . . . . . . . . . . . . I;~5 . . . I················ I
12;;/
500
500
1000
Well No.1
m
o
I
Well No.2
Well No. 3
....
1'205
=
I .............. I "i6' ........ I
500
I
1000
I 1000
Well No.4
I
m
o
500
I 1000
EP. Agterberg . EM. Gradstein
Fig.2 Biostratigraphic correlation with error bars
(95% confidence limits) obtained by CASC for three
events in four wells (based
on Albian-Cenomanian
Scaled Optimum Sequence,
Fig. 1). Top diagram Observed data: last occurrence
of Heterosphaeridium difficile (205) and last common
occurrence of Hedbergella
delrioensis (212) with error
bars around probable positions. Bottom diagram Probable positions for same two
events and last occurrence of
Hedbergella delrioensis (16)
with error bars. The error
bars for probable positions
are shorter
because, under the assumption of normal frequency distributions for all events,
approximately 5% of plotted locations would fall outside their 95% confidence
limits. However, if a point is relatively far away from its error bar (e.g., 4 or more
standard deviations from its probable position), an anomalous situation (e.g.,
reworking) would be indicated.
Error bars (95% confidence limits) for the probable locations of three events
are shown in the bottom part of Fig. 2 (event 16: last occurrence of Hedbergella
delrioensis was added). These error bars tend to be narrower than those for the
observed positions.
3
The Frequency Distribution of Events
RAse and eAse operate in the direction of the axis of time. All observed superpositional relations between fossil events are projected onto a single axis for rel-