

264
53
12
57
66
447
526
342
,---_ _ 170
. -__ ---'-______ '90
, -_ _ _ _ L -_ _ _ _ _ _ _ _ _ ,~
,--_________ .364
, -____ ~ ________ ~ ______ ~ __________ '52
38
0.6133
0.2995
-0.0142
EP. Agterberg . EM. Gradstein
0.2589
0.0294
0.1619
0.0290
0.1271
0.1277
0.0096
0.2812
0.0860
0.0783
0.0028
0.0844
0.0516
0.0481
0.ln3
0.4655
(0.1677)
(0.0321)
(0.0504)
0.1001
0.1865
0.2935
0.1779
0.1713
0.5963
(0.1406)
0.0900
(0.0338)
CIT boundary gamma spike
Uvigerammina jankoi
Hedbergella delrioensis
Endoceratium dettmannlae
Cyclonephelium membraniphorum
Glomospirelia gaultina
Hedbergella planispira
Batioladinium jaegeri
Utosphaeridium siphoniphorum
Hedbergella delrioensis LCO
Textularia foeda
Valvulineria gracillima
Xiphophoridium alatum
Epelidosphaeridia spinosa
Gavelinella jntermedia
Rhombodella paucispina
- Textularia sp. 1 B&R81
.. Sigmailina antiqua
.. Pseudotextulariella cretosa
Endoceratium tumen
Ovoidillium verrucosum
utosphaeridium conisplnum
Hedbergella delrloensis FCD
Ovoidinium scabrosum
Apteodlnlum grande
.. Trochammina "globorotaliforrnis" Strati
Lltosphaeridium arundum
.. Hedbergella planlspira FCC
Falsogaudryinellla sp. 1
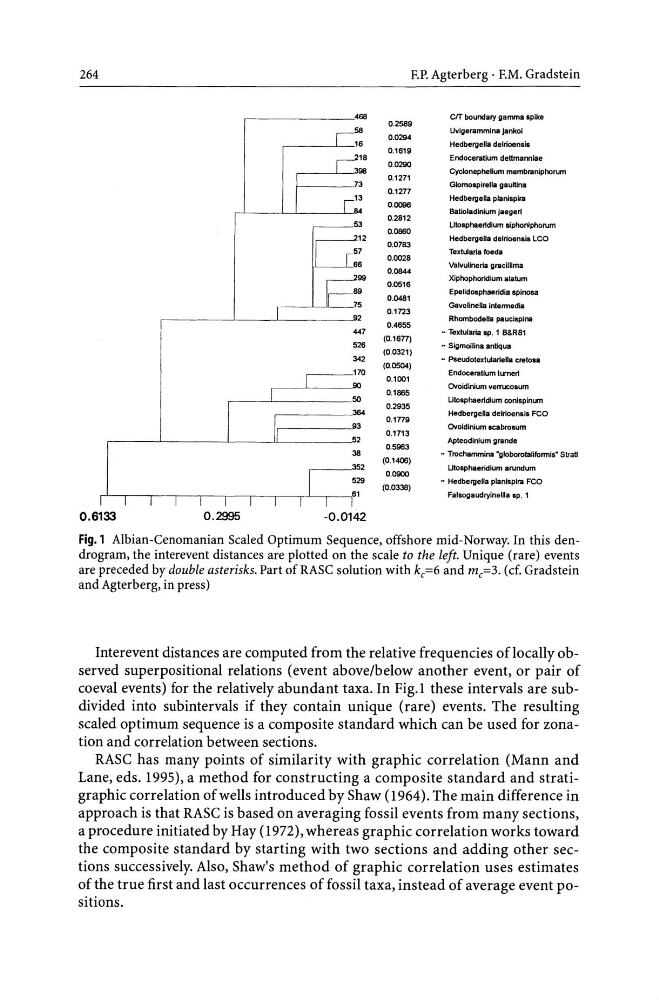
Fig.l Albian-Cenomanian Scaled Optimum Sequence, offshore mid-Norway. In this dendrogram, the interevent distances are plotted on the scale to the left. Unique (rare) events
are preceded by double asterisks. Part of RASC solution with k c =6 and m c =3. (cf. Gradstein
and Agterberg, in press)
Interevent distances are computed from the relative frequencies of locally observed superpositional relations (event above/below another event, or pair of
coeval events) for the relatively abundant taxa. In Fig.l these intervals are subdivided into subintervals if they contain unique (rare) events. The resulting
scaled optimum sequence is a composite standard which can be used for zonation and correlation between sections.
RAse has many points of similarity with graphic correlation (Mann and
Lane, eds. 1995), a method for constructing a composite standard and stratigraphie correlation of wells introduced by Shaw (1964). The main difference in
approach is that RAse is based on averaging fossil events from many sections,
a procedure initiated by Hay (1972), whereas graphic correlation works toward
the composite standard by starting with two sections and adding other sections successively. Also, Shaw's method of graphic correlation uses estimates
of the true first and last occurrences of fossil taxa, instead of average event positions.
53
12
57
66
447
526
342
,---_ _ 170
. -__ ---'-______ '90
, -_ _ _ _ L -_ _ _ _ _ _ _ _ _ ,~
,--_________ .364
, -____ ~ ________ ~ ______ ~ __________ '52
38
0.6133
0.2995
-0.0142
EP. Agterberg . EM. Gradstein
0.2589
0.0294
0.1619
0.0290
0.1271
0.1277
0.0096
0.2812
0.0860
0.0783
0.0028
0.0844
0.0516
0.0481
0.ln3
0.4655
(0.1677)
(0.0321)
(0.0504)
0.1001
0.1865
0.2935
0.1779
0.1713
0.5963
(0.1406)
0.0900
(0.0338)
CIT boundary gamma spike
Uvigerammina jankoi
Hedbergella delrioensis
Endoceratium dettmannlae
Cyclonephelium membraniphorum
Glomospirelia gaultina
Hedbergella planispira
Batioladinium jaegeri
Utosphaeridium siphoniphorum
Hedbergella delrioensis LCO
Textularia foeda
Valvulineria gracillima
Xiphophoridium alatum
Epelidosphaeridia spinosa
Gavelinella jntermedia
Rhombodella paucispina
- Textularia sp. 1 B&R81
.. Sigmailina antiqua
.. Pseudotextulariella cretosa
Endoceratium tumen
Ovoidillium verrucosum
utosphaeridium conisplnum
Hedbergella delrloensis FCD
Ovoidinium scabrosum
Apteodlnlum grande
.. Trochammina "globorotaliforrnis" Strati
Lltosphaeridium arundum
.. Hedbergella planlspira FCC
Falsogaudryinellla sp. 1
Fig.l Albian-Cenomanian Scaled Optimum Sequence, offshore mid-Norway. In this dendrogram, the interevent distances are plotted on the scale to the left. Unique (rare) events
are preceded by double asterisks. Part of RASC solution with k c =6 and m c =3. (cf. Gradstein
and Agterberg, in press)
Interevent distances are computed from the relative frequencies of locally observed superpositional relations (event above/below another event, or pair of
coeval events) for the relatively abundant taxa. In Fig.l these intervals are subdivided into subintervals if they contain unique (rare) events. The resulting
scaled optimum sequence is a composite standard which can be used for zonation and correlation between sections.
RAse has many points of similarity with graphic correlation (Mann and
Lane, eds. 1995), a method for constructing a composite standard and stratigraphie correlation of wells introduced by Shaw (1964). The main difference in
approach is that RAse is based on averaging fossil events from many sections,
a procedure initiated by Hay (1972), whereas graphic correlation works toward
the composite standard by starting with two sections and adding other sections successively. Also, Shaw's method of graphic correlation uses estimates
of the true first and last occurrences of fossil taxa, instead of average event positions.