

Milankovitch Cycles and Sequences: Two Different Stratigraphic Tools
259
Bed thickness
Ma high
low
5
4
c:
til
·c
til
E 3
0
c:
CIl
U
2
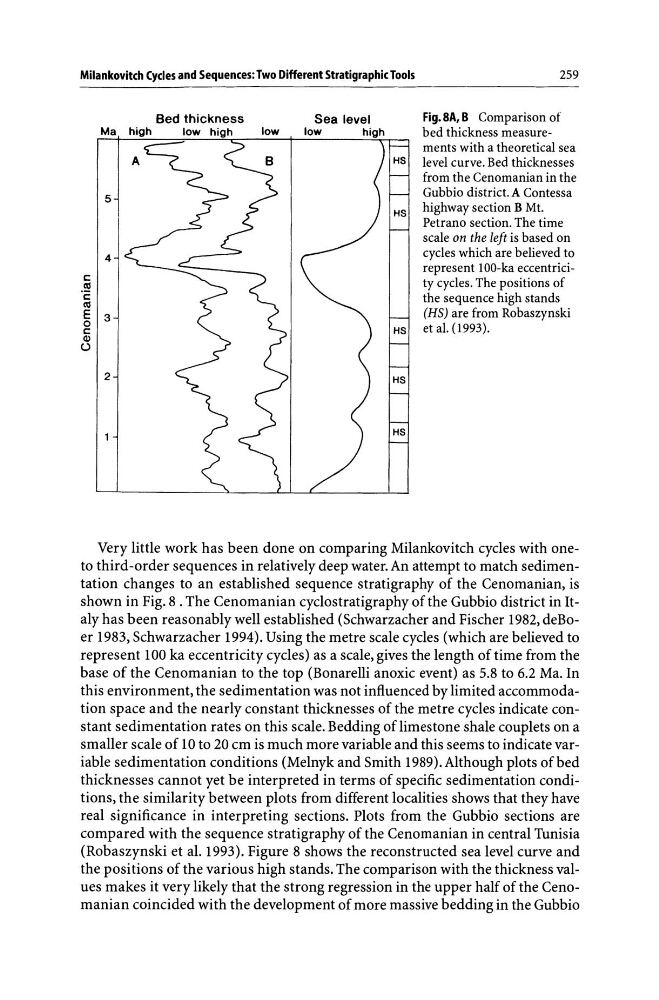
Fig.8A, B Comparison of
bed thickness measurements with a theoretical sea
HS
level curve. Bed thicknesses
from the Cenomanian in the
Gubbio district. A Contessa
highway section B Mt.
Petrano section. The time
HS
HS
HS
HS
scale on the left is based on
cycles which are believed to
represent lOO-ka eccentricity cycles. The positions of
the sequence high stands
(HS) are from Robaszynski
et al. (1993).
Very little work has been done on comparing Milankovitch cycles with oneto third -order sequences in relatively deep water. An attempt to match sedimentation changes to an established sequence stratigraphy of the Cenomanian, is
shown in Fig. 8. The Cenomanian cyclostratigraphy of the Gubbio district in italy has been reasonably well established (Schwarzacher and Fischer 1982, deBoer 1983, Schwarzacher 1994). Using the metre scale cycles (which are believed to
represent 100 ka eccentricity cycles) as a scale, gives the length of time from the
base of the Cenomanian to the top (Bonarelli anoxic event) as 5.8 to 6.2 Ma. In
this environment, the sedimentation was not influenced by limited accommodation space and the nearly constant thicknesses of the metre cycles indicate constant sedimentation rates on this scale. Bedding of limestone shale couplets on a
smaller scale of lO to 20 cm is much more variable and this seems to indicate variable sedimentation conditions (Melnyk and Smith 1989). Although plots of bed
thicknesses cannot yet be interpreted in terms of specific sedimentation conditions, the similarity between plots from different localities shows that they have
real significance in interpreting sections. Plots from the Gubbio sections are
compared with the sequence stratigraphy of the Cenomanian in central Tunisia
(Robaszynski et aL 1993). Figure 8 shows the reconstructed sea level curve and
the positions of the various high stands. The comparison with the thickness values makes it very likely that the strong regression in the upper half of the Cenomanian coincided with the development of more massive bedding in the Gubbio
259
Bed thickness
Ma high
low
5
4
c:
til
·c
til
E 3
0
c:
CIl
U
2
Fig.8A, B Comparison of
bed thickness measurements with a theoretical sea
HS
level curve. Bed thicknesses
from the Cenomanian in the
Gubbio district. A Contessa
highway section B Mt.
Petrano section. The time
HS
HS
HS
HS
scale on the left is based on
cycles which are believed to
represent lOO-ka eccentricity cycles. The positions of
the sequence high stands
(HS) are from Robaszynski
et al. (1993).
Very little work has been done on comparing Milankovitch cycles with oneto third -order sequences in relatively deep water. An attempt to match sedimentation changes to an established sequence stratigraphy of the Cenomanian, is
shown in Fig. 8. The Cenomanian cyclostratigraphy of the Gubbio district in italy has been reasonably well established (Schwarzacher and Fischer 1982, deBoer 1983, Schwarzacher 1994). Using the metre scale cycles (which are believed to
represent 100 ka eccentricity cycles) as a scale, gives the length of time from the
base of the Cenomanian to the top (Bonarelli anoxic event) as 5.8 to 6.2 Ma. In
this environment, the sedimentation was not influenced by limited accommodation space and the nearly constant thicknesses of the metre cycles indicate constant sedimentation rates on this scale. Bedding of limestone shale couplets on a
smaller scale of lO to 20 cm is much more variable and this seems to indicate variable sedimentation conditions (Melnyk and Smith 1989). Although plots of bed
thicknesses cannot yet be interpreted in terms of specific sedimentation conditions, the similarity between plots from different localities shows that they have
real significance in interpreting sections. Plots from the Gubbio sections are
compared with the sequence stratigraphy of the Cenomanian in central Tunisia
(Robaszynski et aL 1993). Figure 8 shows the reconstructed sea level curve and
the positions of the various high stands. The comparison with the thickness values makes it very likely that the strong regression in the upper half of the Cenomanian coincided with the development of more massive bedding in the Gubbio