

198
W. Ritzrau . H. Fohrmann
Settling velocity
Ws = 30 md-1
Settling velocity
Ws = 50 md-1
Settling velocity
Ws = 80 md-1
1001------:::~;;;.:;;;;;;;;;;;-_;a;l '--------;-b' '-------------,C
10
E
0.1
o
o
~ Q)
(f)
Q)
-5
Q)
> o
.0
ttl
.E
OJ
"iii
I
10- 10
10-8
10'6 0.0001
0.01
1 10-10
10-8
10-0 0.0001
0,01
1 10-10
10-8
10-6 0.0001
0.01
Concentration [gl-1 J
100 ,-----~----,--,
d
e
10
10-'0
10-8
lO-e 0.0001
0.Q1
1 10-:~
lO-B
10-6 0,Q001
0.01
1 1O- 1C
10-8
10-6 0.0001
0.01
Concentration [gl-1 J
c
......
o
o
II
~
"3
rJJ,
......
c
o
o
II
~
U1
"3
rJJ,
......
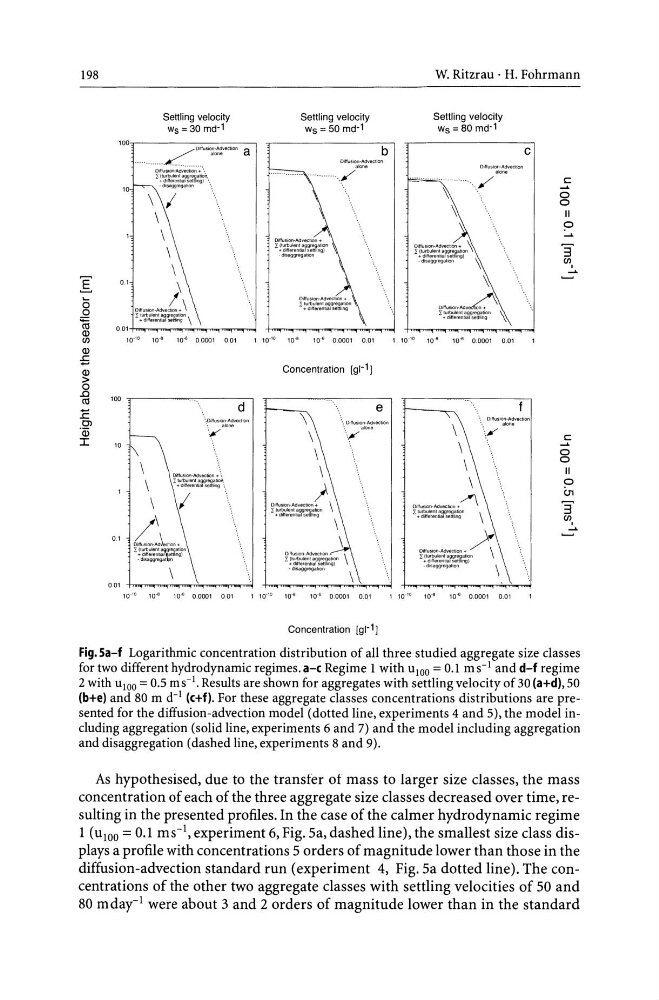
Fig.Sa-f Logarithmic concentration distribution of all three studied aggregate size classes
for two different hydrodynamic regimes. a-c Regime 1 with u lOO = 0.1 m S-1 and d-f regime
2 with ulOO = 0.5 m S-I. Results are shown for aggregates with settling velocity of 30 (a+d), 50
(b+e) and 80 m d- i (c+f). For these aggregate classes concentrations distributions are presented for the diffusion-advection model (dotted line, experiments 4 and 5), the model including aggregation (solid line, experiments 6 and 7) and the model including aggregation
and disaggregation (dashed line, experiments 8 and 9).
As hypothesised, due to the transfer of mass to larger size classes, the mass
concentration of each of the three aggregate size classes decreased over time, resulting in the presented profiles. In the case of the calmer hydrodynamic regime
1 (u lOO = 0.1 ms-I, experiment 6, Fig. Sa, dashed line), the smallest size class displays a profile with concentrations 5 orders of magnitude lower than those in the
diffusion-advection standard run (experiment 4, Fig. Sa dotted line). The concentrations of the other two aggregate classes with settling velocities of 50 and
80 mday-l were about 3 and 2 orders of magnitude lower than in the standard
W. Ritzrau . H. Fohrmann
Settling velocity
Ws = 30 md-1
Settling velocity
Ws = 50 md-1
Settling velocity
Ws = 80 md-1
1001------:::~;;;.:;;;;;;;;;;;-_;a;l '--------;-b' '-------------,C
10
E
0.1
o
o
~ Q)
(f)
Q)
-5
Q)
> o
.0
ttl
.E
OJ
"iii
I
10- 10
10-8
10'6 0.0001
0.01
1 10-10
10-8
10-0 0.0001
0,01
1 10-10
10-8
10-6 0.0001
0.01
Concentration [gl-1 J
100 ,-----~----,--,
d
e
10
10-'0
10-8
lO-e 0.0001
0.Q1
1 10-:~
lO-B
10-6 0,Q001
0.01
1 1O- 1C
10-8
10-6 0.0001
0.01
Concentration [gl-1 J
c
......
o
o
II
~
"3
rJJ,
......
c
o
o
II
~
U1
"3
rJJ,
......
Fig.Sa-f Logarithmic concentration distribution of all three studied aggregate size classes
for two different hydrodynamic regimes. a-c Regime 1 with u lOO = 0.1 m S-1 and d-f regime
2 with ulOO = 0.5 m S-I. Results are shown for aggregates with settling velocity of 30 (a+d), 50
(b+e) and 80 m d- i (c+f). For these aggregate classes concentrations distributions are presented for the diffusion-advection model (dotted line, experiments 4 and 5), the model including aggregation (solid line, experiments 6 and 7) and the model including aggregation
and disaggregation (dashed line, experiments 8 and 9).
As hypothesised, due to the transfer of mass to larger size classes, the mass
concentration of each of the three aggregate size classes decreased over time, resulting in the presented profiles. In the case of the calmer hydrodynamic regime
1 (u lOO = 0.1 ms-I, experiment 6, Fig. Sa, dashed line), the smallest size class displays a profile with concentrations 5 orders of magnitude lower than those in the
diffusion-advection standard run (experiment 4, Fig. Sa dotted line). The concentrations of the other two aggregate classes with settling velocities of 50 and
80 mday-l were about 3 and 2 orders of magnitude lower than in the standard