

178
w
o
::::l
I~
K. Fennel· T. Neumann
LONGITUDE
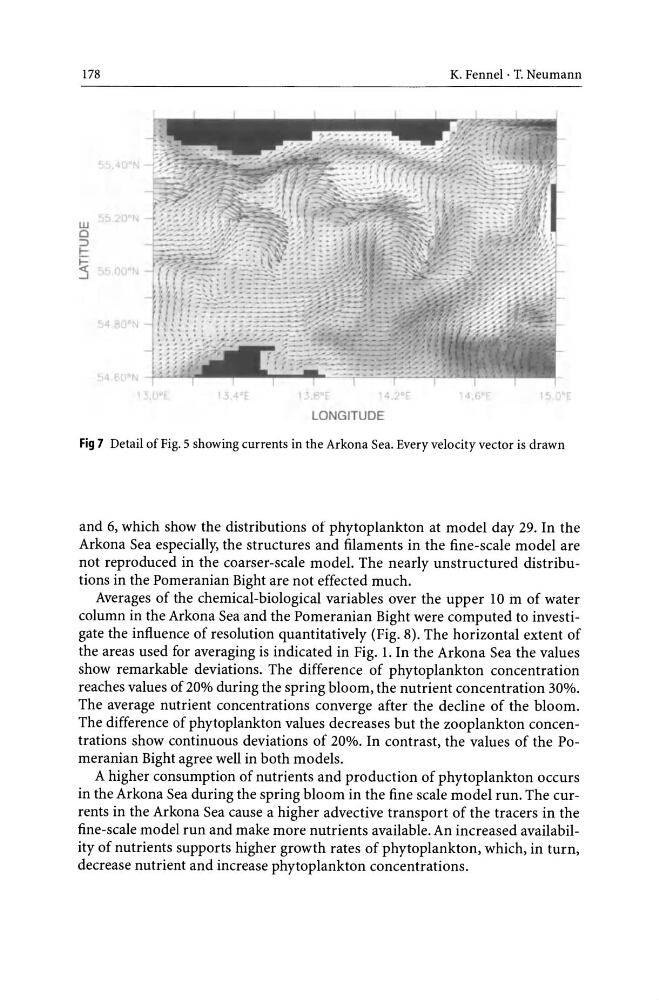
Fig 7 Detail of Fig. 5 showing currents in the Arkona Sea. Every velocity vector is drawn
and 6, which show the distributions of phytoplankton at model day 29. In the
Arkona Sea especially, the structures and filaments in the fine-scale model are
not reproduced in the coarser-scale model. The nearly unstructured distributions in the Pomeranian Bight are not effected much.
Averages of the chemical-biological variables over the upper 10 m of water
column in the Arkona Sea and the Pomeranian Bight were computed to investigate the influence of resolution quantitatively (Fig. 8). The horizontal extent of
the areas used for averaging is indicated in Fig. 1. In the Arkona Sea the values
show remarkable deviations. The difference of phytoplankton concentration
reaches values of 20% during the spring bloom, the nutrient concentration 30%.
The average nutrient concentrations converge after the decline of the bloom.
The difference of phytoplankton values decreases but the zooplankton concentrations show continuous deviations of 20%. In contrast, the values of the Pomeranian Bight agree well in both models.
A higher consumption of nutrients and production of phytoplankton occurs
in the Arkona Sea during the spring bloom in the fine scale model run. The currents in the Arkona Sea cause a higher advective transport of the tracers in the
fine-scale model run and make more nutrients available. An increased availability of nutrients supports higher growth rates of phytoplankton, which, in turn,
decrease nutrient and increase phytoplankton concentrations.
w
o
::::l
I~
K. Fennel· T. Neumann
LONGITUDE
Fig 7 Detail of Fig. 5 showing currents in the Arkona Sea. Every velocity vector is drawn
and 6, which show the distributions of phytoplankton at model day 29. In the
Arkona Sea especially, the structures and filaments in the fine-scale model are
not reproduced in the coarser-scale model. The nearly unstructured distributions in the Pomeranian Bight are not effected much.
Averages of the chemical-biological variables over the upper 10 m of water
column in the Arkona Sea and the Pomeranian Bight were computed to investigate the influence of resolution quantitatively (Fig. 8). The horizontal extent of
the areas used for averaging is indicated in Fig. 1. In the Arkona Sea the values
show remarkable deviations. The difference of phytoplankton concentration
reaches values of 20% during the spring bloom, the nutrient concentration 30%.
The average nutrient concentrations converge after the decline of the bloom.
The difference of phytoplankton values decreases but the zooplankton concentrations show continuous deviations of 20%. In contrast, the values of the Pomeranian Bight agree well in both models.
A higher consumption of nutrients and production of phytoplankton occurs
in the Arkona Sea during the spring bloom in the fine scale model run. The currents in the Arkona Sea cause a higher advective transport of the tracers in the
fine-scale model run and make more nutrients available. An increased availability of nutrients supports higher growth rates of phytoplankton, which, in turn,
decrease nutrient and increase phytoplankton concentrations.