

158
C. N. Wold· G. J. Schwartz· C. Morrill
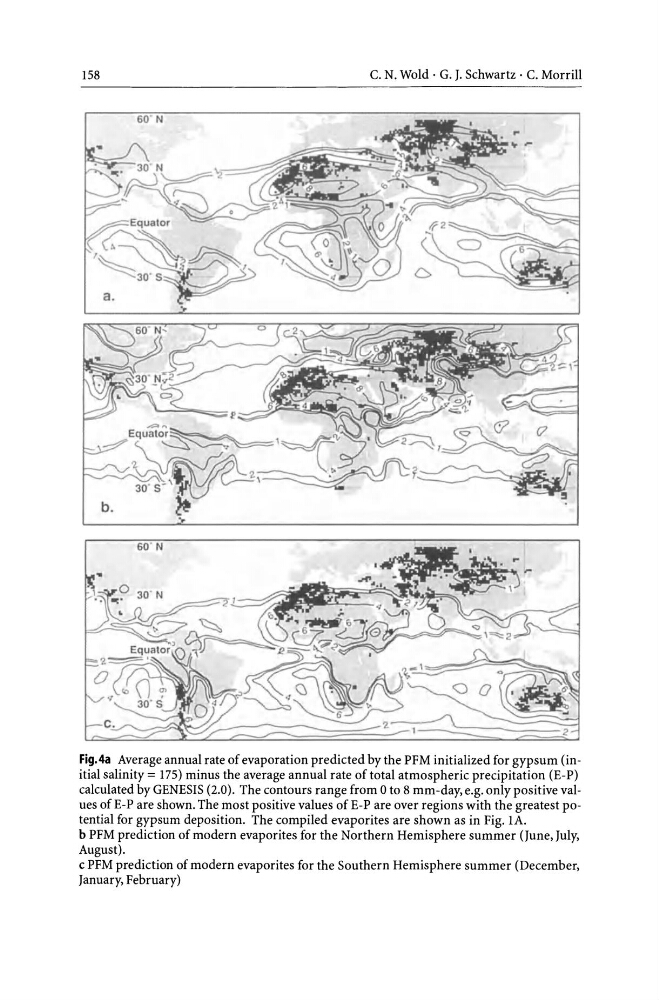
Fig.4a Average annual rate of evaporation predicted by the PFM initialized for gypsum (initial salinity = 175) minus the average annual rate of total atmospheric precipitation (E-P)
calculated by GENESIS (2.0). The contours range from 0 to 8 mm-day, e.g. only positive values of E-P are shown. The most positive values of E-P are over regions with the greatest potential for gypsum deposition. The compiled evaporites are shown as in Fig. 1A.
b PFM prediction of modern evaporites for the Northern Hemisphere summer (June, July,
August).
c PFM prediction of modern evaporites for the Southern Hemisphere summer (December,
January, February)
C. N. Wold· G. J. Schwartz· C. Morrill
Fig.4a Average annual rate of evaporation predicted by the PFM initialized for gypsum (initial salinity = 175) minus the average annual rate of total atmospheric precipitation (E-P)
calculated by GENESIS (2.0). The contours range from 0 to 8 mm-day, e.g. only positive values of E-P are shown. The most positive values of E-P are over regions with the greatest potential for gypsum deposition. The compiled evaporites are shown as in Fig. 1A.
b PFM prediction of modern evaporites for the Northern Hemisphere summer (June, July,
August).
c PFM prediction of modern evaporites for the Southern Hemisphere summer (December,
January, February)