

506
CI)
E
ce
CI)
c
co
Q)
~
4
-S6
a.
Q)
Cl 7
a
200
100
50
b
Closing basin
Rate of closure 5 em/a
A d = eonst.
Sediment supply = eonst.
p"" 1.6
20
Chapter 11 Sediment Supply, Subsidence, and Basin Fill
30
I I
I
I
I
./
..I
I
I
E
4~
I
IJ)
I
IJ)
/
3 ~
I
~
/
u
/
..c
/
2...--.... 1/
----"'-SR
_ _ .,..-me
- - -
I
p=2.05
40
I
I
I
Water depth
I
I
50 Ma
2
Thermal subsidenee of oceanie erust
I Flexure of crust
(5 em/Ma, intermediate phase)
- ~~ - approaehing subduction8
9
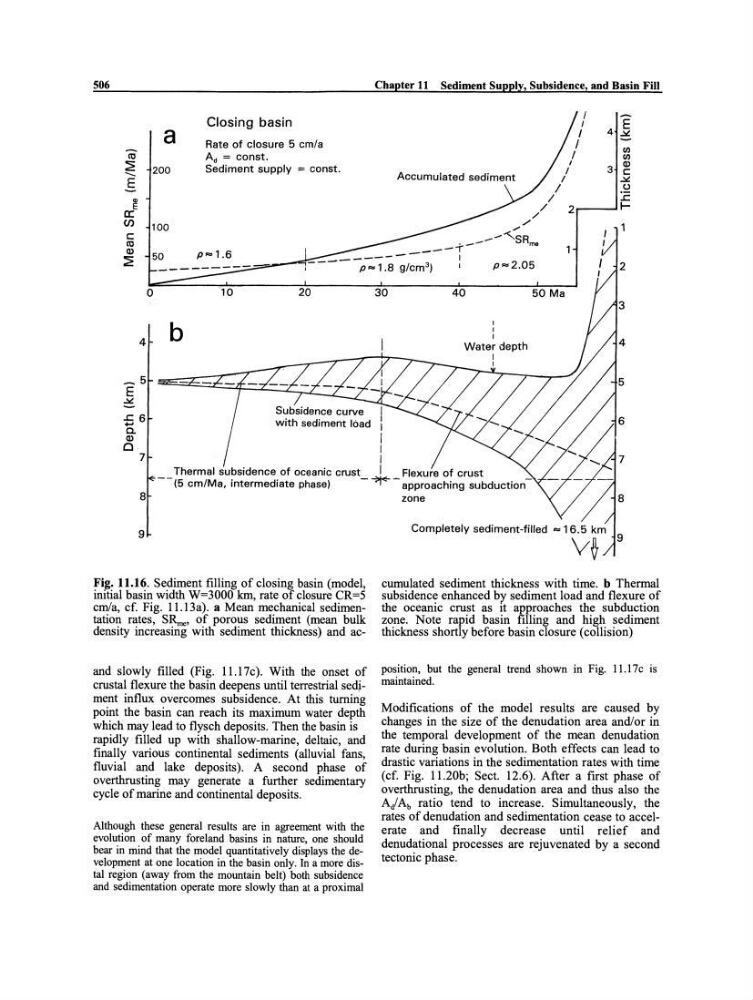
Fig. 11.16. Sediment filling of closing basin (model,
initial basin width W=3000 km, rate of closure CR=5
emla, ef. Fig. 11.13a). a Mean mechanieal sedimentation rates, SR".e' of porous sediment (mean bulk
density increasing with sediment thickness) and acand slowly filled (Fig. 11.17c). With the onset of
crustal flexure the basin deepens until terrestrial sediment influx overcomes subsidence. At this tuming
point the basin can reach its maximum water depth
which may lead to flysch deposits. Then the basin is
rapidly filled up with shallow-marine, deltaic, and
finally various continental sediments (alluvial fans,
fluvial and lake deposits). A second phase of
overthrusting may generate a further sedimentary
eycle of marine and continental deposits.
Although these general results are in agreement with the
evolution of many foreland basins in nature, one should
bear in mind that the model quantitatively displays the development at one loeation in the basin only. In a more distal region (away from the mountain belt) both subsidenee
and sedimentation operate more slowly than at a proximal
zone
Completely sediment-filled =16.5 km
V~
cumulated sediment thickness with time. b Thermal
subsidence enhanced by sediment load and flexure of
the oceanic crust as 1t approaches the subduction
zone. Note rapid basin filling and high sediment
thickness shortly before basin closure (collision)
position, but the general trend shown in Fig. 11.17e is
maintained.
Modifications of the model results are caused by
changes in the size of the denudation area andlor in
the temporal development of the mean denudation
rate during basin evolution. Both effects can lead to
drastic variations in the sedimentation rates with time
(cf. Fig. 11.20b; Sect. 12.6). After a first phase of
overthrusting, the denudation area and thus also the
AiA b ratio tend to increase. Simultaneously, the
rates of denudation and sedimentation cease to accelerate and finally decrease until relief and
denudational processes are rejuvenated by a second
tectonic phase.
CI)
E
ce
CI)
c
co
Q)
~
4
-S6
a.
Q)
Cl 7
a
200
100
50
b
Closing basin
Rate of closure 5 em/a
A d = eonst.
Sediment supply = eonst.
p"" 1.6
20
Chapter 11 Sediment Supply, Subsidence, and Basin Fill
30
I I
I
I
I
./
..I
I
I
E
4~
I
IJ)
I
IJ)
/
3 ~
I
~
/
u
/
..c
/
2...--.... 1/
----"'-SR
_ _ .,..-me
- - -
I
p=2.05
40
I
I
I
Water depth
I
I
50 Ma
2
Thermal subsidenee of oceanie erust
I Flexure of crust
(5 em/Ma, intermediate phase)
- ~~ - approaehing subduction8
9
Fig. 11.16. Sediment filling of closing basin (model,
initial basin width W=3000 km, rate of closure CR=5
emla, ef. Fig. 11.13a). a Mean mechanieal sedimentation rates, SR".e' of porous sediment (mean bulk
density increasing with sediment thickness) and acand slowly filled (Fig. 11.17c). With the onset of
crustal flexure the basin deepens until terrestrial sediment influx overcomes subsidence. At this tuming
point the basin can reach its maximum water depth
which may lead to flysch deposits. Then the basin is
rapidly filled up with shallow-marine, deltaic, and
finally various continental sediments (alluvial fans,
fluvial and lake deposits). A second phase of
overthrusting may generate a further sedimentary
eycle of marine and continental deposits.
Although these general results are in agreement with the
evolution of many foreland basins in nature, one should
bear in mind that the model quantitatively displays the development at one loeation in the basin only. In a more distal region (away from the mountain belt) both subsidenee
and sedimentation operate more slowly than at a proximal
zone
Completely sediment-filled =16.5 km
V~
cumulated sediment thickness with time. b Thermal
subsidence enhanced by sediment load and flexure of
the oceanic crust as 1t approaches the subduction
zone. Note rapid basin filling and high sediment
thickness shortly before basin closure (collision)
position, but the general trend shown in Fig. 11.17e is
maintained.
Modifications of the model results are caused by
changes in the size of the denudation area andlor in
the temporal development of the mean denudation
rate during basin evolution. Both effects can lead to
drastic variations in the sedimentation rates with time
(cf. Fig. 11.20b; Sect. 12.6). After a first phase of
overthrusting, the denudation area and thus also the
AiA b ratio tend to increase. Simultaneously, the
rates of denudation and sedimentation cease to accelerate and finally decrease until relief and
denudational processes are rejuvenated by a second
tectonic phase.