

7.2 Basic Concepts
299
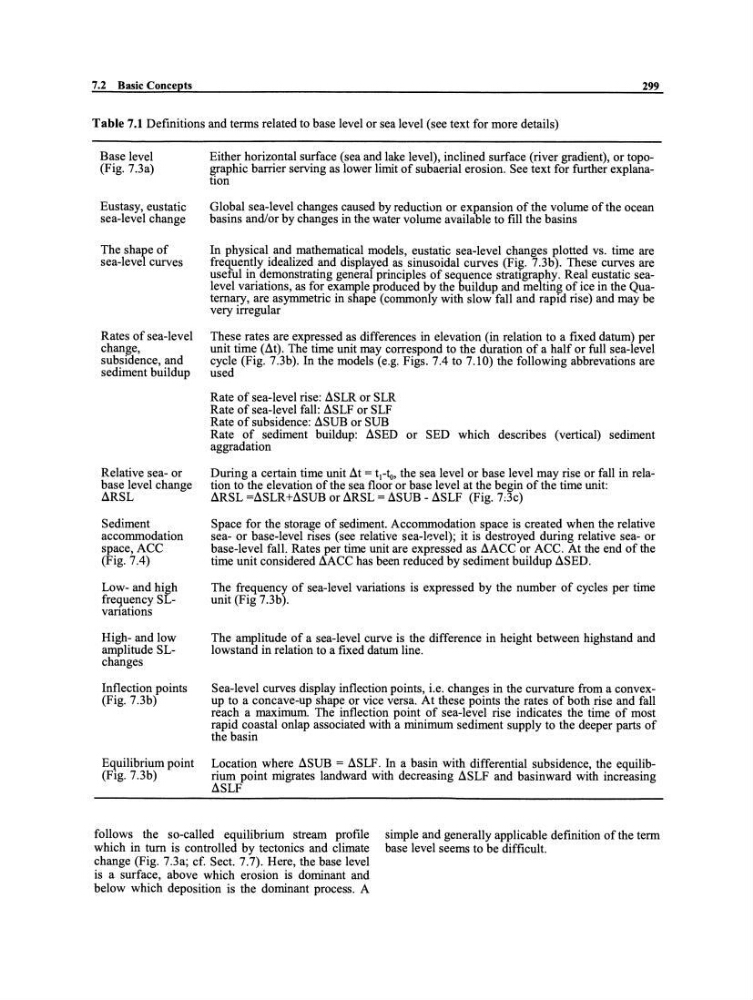
Table 7.1 Definitions and tenns related to base level or sea level (see text for more details)
Base level
(Fig.7.3a)
Eustasy, eustatic
sea-level change
The shape of
sea-level curves
Rates of sea-level
change,
subsidence, and
sediment buildup
Relative sea- or
base level change
ö'RSL
Sediment
accommodation
space, ACC
(Fig.7.4)
Low- and high
frequency SLvariations
High- and low
amplitude SLchanges
Inflection points
(Fig.7.3b)
Equilibrium point
(Fig.7.3b)
Either horizontal surface (sea and lake level), inclined surface (river gradient), or topographie barrier serving as lower limit of subaerial erosion. See text for further explanation
Global sea-level changes caused by reduction or expansion of the volume of the ocean
basins and/or by changes in the water volume available to fill the basins
In physical and mathematical models, eustatic sea-level changes plotted vs. time are
frequently idealized and displayed as sinusoidal curves (Fi~. 7.3b). These curves are
useful in demonstrating general principles of sequence stratlgraphy. Real eustatic sealevel variations, as for example produced by the buildup and meltin~ of ice in the Quaternary, are asymmetrie in shape (commonly with slow fall and rapId rise) and may be
very irregular
These rates are expressed as differences in elevation (in relation to a fixed datum) per
unit time (ö't). The time unit may correspond to the duration of a half or full sea-level
cycle (Fig. 7.3b). In the models (e.g. Figs. 7.4 to 7.10) the following abbrevations are
used
Rate of sea-level rise: ö'SLR or SLR
Rate of sea-level fall: ö'SLF or SLF
Rate of subsidence: ö'SUB or SUB
Rate of sediment buildup: ö'SED or SED which describes (vertical) sediment
aggradation
During a certain time unit ö't = t 1 -1:o, the sea level or base level may rise or fall in relation to the elevation of the sea floor or base level at the begin of the time unit:
ö'RSL =ö'SLR+ö'SUB or ö'RSL = ö'SUB - ö'SLF (Fig.7.3c)
Space for the storage of sediment. Accommodation space is created when the relative
sea- or base-level rises (see relative sea-l~vel); it is destroyed during relative sea- or
base-level fall. Rates per time unit are expressed as ö'ACC or ACC. At the end of the
time unit considered ö'ACC has been reduced by sediment buildup ö'SED.
The frequency of sea-level variations is expressed by the number of cycles per time
unit (Fig 7.3b).
The amplitude of a sea-level curve is the difference in height between highstand and
lowstand in relation to a fixed datum line.
Sea-level curves display inflection points, i.e. changes in the curvature from a convexup to a concave-up shape or vice versa. At these points the rates of both rise and fall
re ach a maximum. The inflection point of sea-level rise indicates the time of most
rapid coastal onlap associated with a minimum sediment supply to the deeper parts of
the basin
Location where ö'SUB = ö'SLF. In a basin with differential subsidence, the equilibrium point migrates landward with decreasing ö'SLF and basinward with increasing
ö'SLF
follows the so-called equilibrium stream profile
which in turn is controlled by tectonics and climate
change (Fig. 7.3a; cf. Sect. 7.7). Here, the base level
is a surface, above which erosion is dominant and
below which deposition is the dominant process. A
simple and generally applicable definition of the tenn
base level seems to be difficult.
299
Table 7.1 Definitions and tenns related to base level or sea level (see text for more details)
Base level
(Fig.7.3a)
Eustasy, eustatic
sea-level change
The shape of
sea-level curves
Rates of sea-level
change,
subsidence, and
sediment buildup
Relative sea- or
base level change
ö'RSL
Sediment
accommodation
space, ACC
(Fig.7.4)
Low- and high
frequency SLvariations
High- and low
amplitude SLchanges
Inflection points
(Fig.7.3b)
Equilibrium point
(Fig.7.3b)
Either horizontal surface (sea and lake level), inclined surface (river gradient), or topographie barrier serving as lower limit of subaerial erosion. See text for further explanation
Global sea-level changes caused by reduction or expansion of the volume of the ocean
basins and/or by changes in the water volume available to fill the basins
In physical and mathematical models, eustatic sea-level changes plotted vs. time are
frequently idealized and displayed as sinusoidal curves (Fi~. 7.3b). These curves are
useful in demonstrating general principles of sequence stratlgraphy. Real eustatic sealevel variations, as for example produced by the buildup and meltin~ of ice in the Quaternary, are asymmetrie in shape (commonly with slow fall and rapId rise) and may be
very irregular
These rates are expressed as differences in elevation (in relation to a fixed datum) per
unit time (ö't). The time unit may correspond to the duration of a half or full sea-level
cycle (Fig. 7.3b). In the models (e.g. Figs. 7.4 to 7.10) the following abbrevations are
used
Rate of sea-level rise: ö'SLR or SLR
Rate of sea-level fall: ö'SLF or SLF
Rate of subsidence: ö'SUB or SUB
Rate of sediment buildup: ö'SED or SED which describes (vertical) sediment
aggradation
During a certain time unit ö't = t 1 -1:o, the sea level or base level may rise or fall in relation to the elevation of the sea floor or base level at the begin of the time unit:
ö'RSL =ö'SLR+ö'SUB or ö'RSL = ö'SUB - ö'SLF (Fig.7.3c)
Space for the storage of sediment. Accommodation space is created when the relative
sea- or base-level rises (see relative sea-l~vel); it is destroyed during relative sea- or
base-level fall. Rates per time unit are expressed as ö'ACC or ACC. At the end of the
time unit considered ö'ACC has been reduced by sediment buildup ö'SED.
The frequency of sea-level variations is expressed by the number of cycles per time
unit (Fig 7.3b).
The amplitude of a sea-level curve is the difference in height between highstand and
lowstand in relation to a fixed datum line.
Sea-level curves display inflection points, i.e. changes in the curvature from a convexup to a concave-up shape or vice versa. At these points the rates of both rise and fall
re ach a maximum. The inflection point of sea-level rise indicates the time of most
rapid coastal onlap associated with a minimum sediment supply to the deeper parts of
the basin
Location where ö'SUB = ö'SLF. In a basin with differential subsidence, the equilibrium point migrates landward with decreasing ö'SLF and basinward with increasing
ö'SLF
follows the so-called equilibrium stream profile
which in turn is controlled by tectonics and climate
change (Fig. 7.3a; cf. Sect. 7.7). Here, the base level
is a surface, above which erosion is dominant and
below which deposition is the dominant process. A
simple and generally applicable definition of the tenn
base level seems to be difficult.