

4 Extraction of Intermediate Scale Sea Ice Deformation Parameters from SAR Ice Motion Products
81
where (J'is the standard deviation of errors, Er the deformation for individual cells and
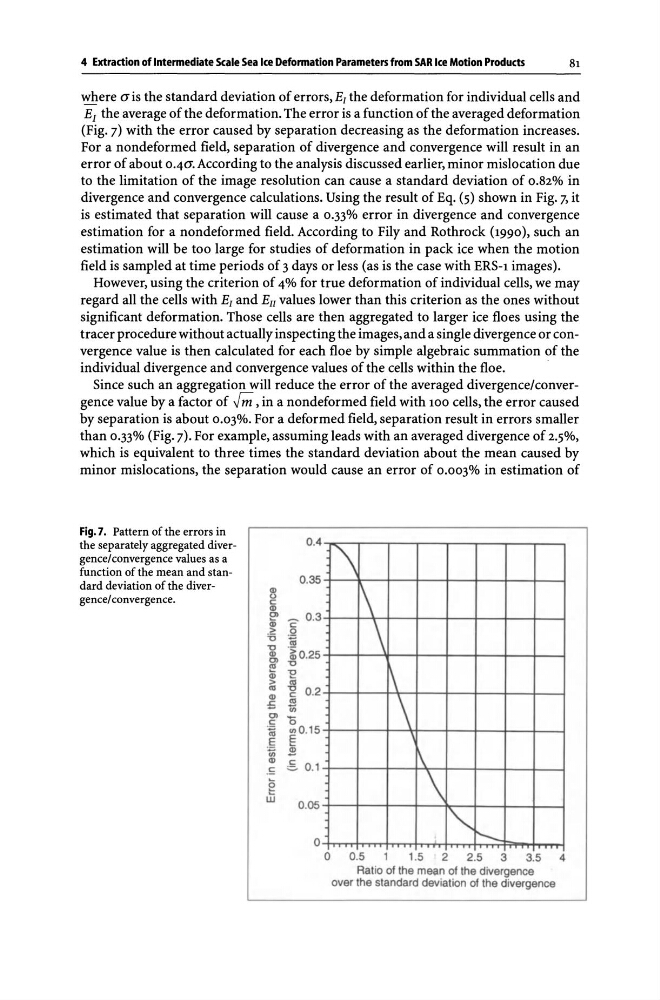
E[ the average of the deformation. The error is a function of the averaged deformation
(Fig. 7) with the error caused by separation decreasing as the deformation increases.
For a non deformed field, separation of divergence and convergence will result in an
error of about 0.4(J'. According to the analysis discussed earlier, minor mislocation due
to the limitation of the image resolution can cause a standard deviation of 0.82% in
divergence and convergence calculations. Using the result of Eq. (5) shown in Fig. 7, it
is estimated that separation will cause a 0.33% error in divergence and convergence
estimation for a nondeformed field. According to Fily and Rothrock (1990), such an
estimation will be too large for studies of deformation in pack ice when the motion
field is sampled at time periods of 3 days or less (as is the case with ERS-l images).
However, using the criterion of 4% for true deformation of individual cells, we may
regard all the cells with Er and Ell values lower than this criterion as the ones without
significant deformation. Those cells are then aggregated to larger ice floes using the
tracer procedure without actually inspecting the images, and a single divergence or convergence value is then calculated for each floe by simple algebraic summation of the
individual divergence and convergence values of the cells within the floe.
.
Since such an aggregation will reduce the error of the averaged divergence/convergence value by a factor of .r;;; , in a nondeformed field with 100 cells, the error caused
by separation is about 0.03%. For a deformed field, separation result in errors smaller
than 0.33% (Fig. 7). For example, assuming leads with an averaged divergence of 2.5%,
which is equivalent to three times the standard deviation about the mean caused by
minor mislocations, the separation would cause an error of 0.003% in estimation of
Fig. 7. Pattern of the errors in
the separately aggregated divergence/ convergence values as a
function of the mean and standard deviation of the divergence/convergence.
c:
QJ
>
'6
"'C
~
.!;
to
QJ
.~
0 t:
w
0.4
0.35
"2
0.3
.9
<0
·~0 .25
"'C
"E
'"
"'C 0.2
c:
'"
to
"0
",0.15
E
2
~ 0.1
0.05
o
'\
\ \
\
\
\ \
I'" r--o 0.5
1.5
2
2.5
3
3.5
4
Rat io of the mean of the divergence
over the standard deviation of the divergence
81
where (J'is the standard deviation of errors, Er the deformation for individual cells and
E[ the average of the deformation. The error is a function of the averaged deformation
(Fig. 7) with the error caused by separation decreasing as the deformation increases.
For a non deformed field, separation of divergence and convergence will result in an
error of about 0.4(J'. According to the analysis discussed earlier, minor mislocation due
to the limitation of the image resolution can cause a standard deviation of 0.82% in
divergence and convergence calculations. Using the result of Eq. (5) shown in Fig. 7, it
is estimated that separation will cause a 0.33% error in divergence and convergence
estimation for a nondeformed field. According to Fily and Rothrock (1990), such an
estimation will be too large for studies of deformation in pack ice when the motion
field is sampled at time periods of 3 days or less (as is the case with ERS-l images).
However, using the criterion of 4% for true deformation of individual cells, we may
regard all the cells with Er and Ell values lower than this criterion as the ones without
significant deformation. Those cells are then aggregated to larger ice floes using the
tracer procedure without actually inspecting the images, and a single divergence or convergence value is then calculated for each floe by simple algebraic summation of the
individual divergence and convergence values of the cells within the floe.
.
Since such an aggregation will reduce the error of the averaged divergence/convergence value by a factor of .r;;; , in a nondeformed field with 100 cells, the error caused
by separation is about 0.03%. For a deformed field, separation result in errors smaller
than 0.33% (Fig. 7). For example, assuming leads with an averaged divergence of 2.5%,
which is equivalent to three times the standard deviation about the mean caused by
minor mislocations, the separation would cause an error of 0.003% in estimation of
Fig. 7. Pattern of the errors in
the separately aggregated divergence/ convergence values as a
function of the mean and standard deviation of the divergence/convergence.
c:
QJ
>
'6
"'C
~
.!;
to
QJ
.~
0 t:
w
0.4
0.35
"2
0.3
.9
<0
·~0 .25
"'C
"E
'"
"'C 0.2
c:
'"
to
"0
",0.15
E
2
~ 0.1
0.05
o
'\
\ \
\
\
\ \
I'" r--o 0.5
1.5
2
2.5
3
3.5
4
Rat io of the mean of the divergence
over the standard deviation of the divergence