

D.G. BARBER, A. THOMAS, AND T.N. PAPAKYRIAKOU
• 0"=""2200 hrs
• 0"=-l300 hrs
-15.0 o ~ • -
0 --\
at:>
~
..,
e -1 6.0
..,
"
<
- 17.0
-18.0 L...o........-..........L~ ......... ~ ..................... ~--.J
105 110 115 120 125 130140
Julian Day
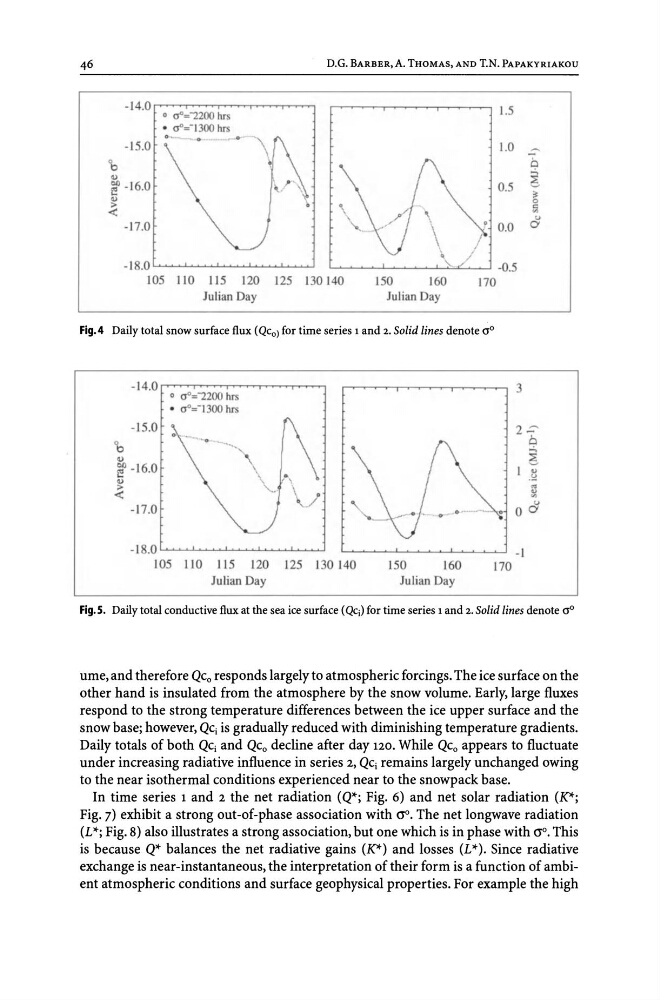
Fig.4 Daily total snow surface flux (Qco) for time series 1 and 2. Solid lines denote aO
'b ..,
- 15.0
o 0"= ""22()() hrs
• o"=-13()() hrs
e -16.0
..,
"
<
- 17.0
- 18.0L....... ....... ~ ........... ~ ......... ~ .......... .........J
105 110 115 120 125 130140
Julian Day
150
160
Julian Day
3
2-='
C:l
~
"
.\:!
.. 1;1
O~
- I
170
Fig. S. Daily total conductive flux at the sea ice surface (QCj) for time series 1 and 2. Solid lines denote aO
ume, and therefore Qco responds largely to atmospheric forcings. The ice surface on the
other hand is insulated from the atmosphere by the snow volume. Early, large fluxes
respond to the strong temperature differences between the ice upper surface and the
snow base; however, QCj is gradually reduced with diminishing temperature gradients.
Daily totals of both QCj and Qco decline after day 120. While Qco appears to fluctuate
under increasing radiative influence in series 2, QCj remains largely unchanged owing
to the near isothermal conditions experienced near to the snowpack base.
In time series 1 and 2 the net radiation (Q*; Fig. 6) and net solar radiation (K*;
Fig. 7) exhibit a strong out-of-phase association with cr o • The net longwave radiation
(L*; Fig. 8) also illustrates a strong association, but one which is in phase with cr o • This
is because Q* balances the net radiative gains (K*) and losses (L*). Since radiative
exchange is near-instantaneous, the interpretation of their form is a function of ambient atmospheric conditions and surface geophysical properties. For example the high
• 0"=""2200 hrs
• 0"=-l300 hrs
-15.0 o ~ • -
0 --\
at:>
~
..,
e -1 6.0
..,
"
<
- 17.0
-18.0 L...o........-..........L~ ......... ~ ..................... ~--.J
105 110 115 120 125 130140
Julian Day
Fig.4 Daily total snow surface flux (Qco) for time series 1 and 2. Solid lines denote aO
'b ..,
- 15.0
o 0"= ""22()() hrs
• o"=-13()() hrs
e -16.0
..,
"
<
- 17.0
- 18.0L....... ....... ~ ........... ~ ......... ~ .......... .........J
105 110 115 120 125 130140
Julian Day
150
160
Julian Day
3
2-='
C:l
~
"
.\:!
.. 1;1
O~
- I
170
Fig. S. Daily total conductive flux at the sea ice surface (QCj) for time series 1 and 2. Solid lines denote aO
ume, and therefore Qco responds largely to atmospheric forcings. The ice surface on the
other hand is insulated from the atmosphere by the snow volume. Early, large fluxes
respond to the strong temperature differences between the ice upper surface and the
snow base; however, QCj is gradually reduced with diminishing temperature gradients.
Daily totals of both QCj and Qco decline after day 120. While Qco appears to fluctuate
under increasing radiative influence in series 2, QCj remains largely unchanged owing
to the near isothermal conditions experienced near to the snowpack base.
In time series 1 and 2 the net radiation (Q*; Fig. 6) and net solar radiation (K*;
Fig. 7) exhibit a strong out-of-phase association with cr o • The net longwave radiation
(L*; Fig. 8) also illustrates a strong association, but one which is in phase with cr o • This
is because Q* balances the net radiative gains (K*) and losses (L*). Since radiative
exchange is near-instantaneous, the interpretation of their form is a function of ambient atmospheric conditions and surface geophysical properties. For example the high