

12 Towards Operational Monitoring of Arctic Sea Ice by SAR
Table 2. Generation of ice-type concentration products: Manual and automated tasks
Manual
Selection of segmentation parameters:
• Smoothing
• Edge detection threshold
Vetting of result (iteration if required)
Selection of region attributes
Construction of training dataset
Selection of region attributes
Selection of K -NN or MLP algorithm
Vetting of result (iteration if required)
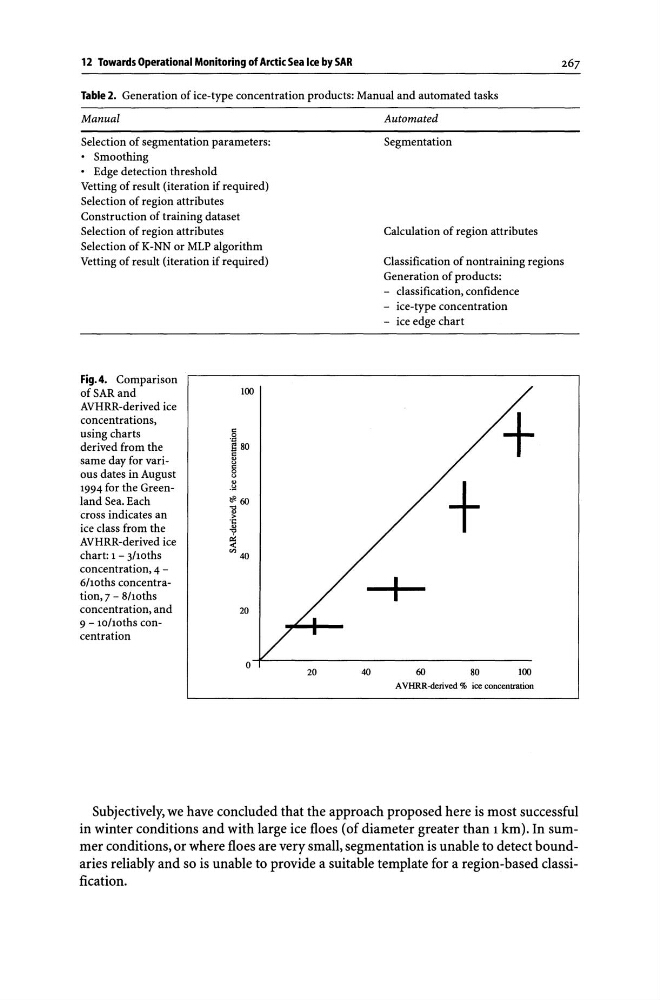
Fig.4. Comparison
ofSARand
100
AVHRR-derived ice
concentrations,
using charts
"
.g
derived from the
g80
same day for vari5
g
ous dates in August
8
"
1994 for the Green.~
land Sea. Each
""60
cross indicates an
il ;.
ice class from the
·c
~
AVHRR-derived ice
-<
chart: 1 - 3hoths
"'40
concentration, 4 -
6/lOths concentration,7 - 8hoths
concentration, and
20
9 - 10/lOths concentration
o
20
40
Automated
Segmentation
Calculation of region attributes
Classification of nontraining regions
Generation of products:
- classification, confidence
- ice-type concentration
- ice edge chart
+
60
80
100
A VHRR-derived % ice concentration
Subjectively, we have concluded that the approach proposed here is most successful
in winter conditions and with large ice floes (of diameter greater than 1 km). In summer conditions, or where floes are very small, segmentation is unable to detect boundaries reliably and so is unable to provide a suitable template for a region-based classification.
Table 2. Generation of ice-type concentration products: Manual and automated tasks
Manual
Selection of segmentation parameters:
• Smoothing
• Edge detection threshold
Vetting of result (iteration if required)
Selection of region attributes
Construction of training dataset
Selection of region attributes
Selection of K -NN or MLP algorithm
Vetting of result (iteration if required)
Fig.4. Comparison
ofSARand
100
AVHRR-derived ice
concentrations,
using charts
"
.g
derived from the
g80
same day for vari5
g
ous dates in August
8
"
1994 for the Green.~
land Sea. Each
""60
cross indicates an
il ;.
ice class from the
·c
~
AVHRR-derived ice
-<
chart: 1 - 3hoths
"'40
concentration, 4 -
6/lOths concentration,7 - 8hoths
concentration, and
20
9 - 10/lOths concentration
o
20
40
Automated
Segmentation
Calculation of region attributes
Classification of nontraining regions
Generation of products:
- classification, confidence
- ice-type concentration
- ice edge chart
+
60
80
100
A VHRR-derived % ice concentration
Subjectively, we have concluded that the approach proposed here is most successful
in winter conditions and with large ice floes (of diameter greater than 1 km). In summer conditions, or where floes are very small, segmentation is unable to detect boundaries reliably and so is unable to provide a suitable template for a region-based classification.