

12 Towards Operational Monitoring of Arctic Sea Ice by SAR
Instead, Sephton et al. (1994) have evaluated the performance of the ratio of the local
standard deviation to mean, crill, calculated within a 5 x 5 pixel window and assigned
to the central pixel in the window as it is passed across the image. Although crill is a less
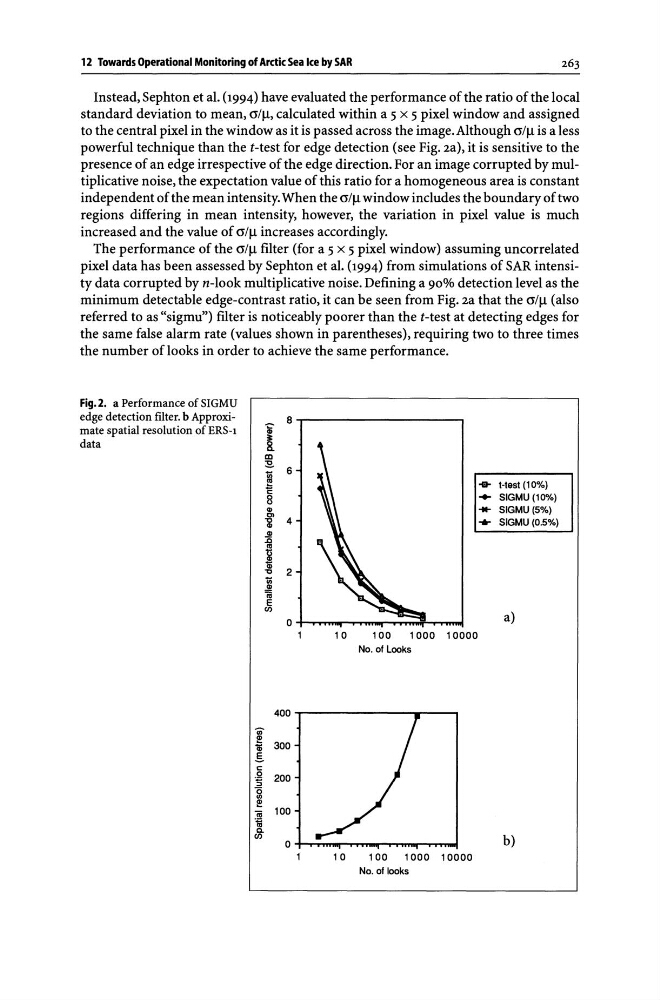
powerful technique than the t-test for edge detection (see Fig. 2a), it is sensitive to the
presence of an edge irrespective of the edge direction. For an image corrupted by multiplicative noise, the expectation value of this ratio for a homogeneous area is constant
independent of the mean intensity. When the crill window includes the boundary of two
regions differing in mean intensity, however, the variation in pixel value is much
increased and the value of crill increases accordingly.
The performance of the crill filter (for a 5 x 5 pixel window) assuming uncorrelated
pixel data has been assessed by Sephton et al. (1994) from simulations of SAR intensity data corrupted by n-Iook multiplicative noise. Defining a 90% detection level as the
minimum detectable edge-contrast ratio, it can be seen from Fig. 2a that the crill (also
referred to as "sigmu") filter is noticeably poorer than the t-test at detecting edges for
the same false alarm rate (values shown in parentheses), requiring two to three times
the number of looks in order to achieve the same performance.
Fig. 2. a Performance of SIGMU
edge detection filter. b Approximate spatial resolution of ERS-I
data
.,
~
a;
.§.
c:
.Q
5
0
'" ~
:m 1;;
Q.
en
I
8~------------------~
I 8
. .
f 4
.!!!
.c .,
11 a; 2
'0
U;
.!!!
Cii
E
en
0
1
10
100
1000 10000
No. of Looks
400
300
200
100
0
10
100
1000 10000
No. of looks
-ill- t-test (10%)
... SIGMU(10%)
... SIGMU(5%)
... SIGMU (0.5%)
a)
b)
Instead, Sephton et al. (1994) have evaluated the performance of the ratio of the local
standard deviation to mean, crill, calculated within a 5 x 5 pixel window and assigned
to the central pixel in the window as it is passed across the image. Although crill is a less
powerful technique than the t-test for edge detection (see Fig. 2a), it is sensitive to the
presence of an edge irrespective of the edge direction. For an image corrupted by multiplicative noise, the expectation value of this ratio for a homogeneous area is constant
independent of the mean intensity. When the crill window includes the boundary of two
regions differing in mean intensity, however, the variation in pixel value is much
increased and the value of crill increases accordingly.
The performance of the crill filter (for a 5 x 5 pixel window) assuming uncorrelated
pixel data has been assessed by Sephton et al. (1994) from simulations of SAR intensity data corrupted by n-Iook multiplicative noise. Defining a 90% detection level as the
minimum detectable edge-contrast ratio, it can be seen from Fig. 2a that the crill (also
referred to as "sigmu") filter is noticeably poorer than the t-test at detecting edges for
the same false alarm rate (values shown in parentheses), requiring two to three times
the number of looks in order to achieve the same performance.
Fig. 2. a Performance of SIGMU
edge detection filter. b Approximate spatial resolution of ERS-I
data
.,
~
a;
.§.
c:
.Q
5
0
'" ~
:m 1;;
Q.
en
I
8~------------------~
I 8
. .
f 4
.!!!
.c .,
11 a; 2
'0
U;
.!!!
Cii
E
en
0
1
10
100
1000 10000
No. of Looks
400
300
200
100
0
10
100
1000 10000
No. of looks
-ill- t-test (10%)
... SIGMU(10%)
... SIGMU(5%)
... SIGMU (0.5%)
a)
b)