

260
Table 1. IPAP Operator Requirements
Product
Ice type and concentration
Ice edge
Ice motion
Iceberg detection
Enhanced SAR imagery
(speckle-suppressed and
contrast enhanced)
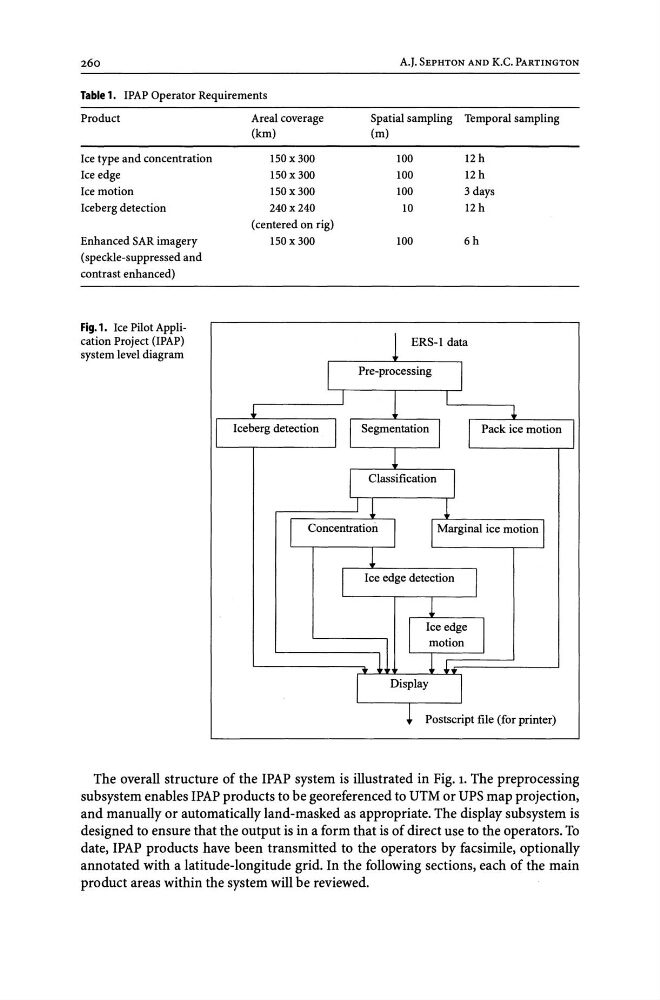
Fig.1. Ice Pilot Application Project (IPAP)
system level diagram
I
Areal coverage
(km)
150 x 300
150 x 300
150 x 300
240 x 240
(centered on rig)
150 x 300
I
~
Iceberg detection
I
II
I
A.J. SEPHTON AND K.C. PARTINGTON
Spatial sampling Temporal sampling
(m)
100
100
100
10
100
12 h
12 h
3 days
12 h
6h
1 ERS-l data
Pre-processing
I
I
.J..
Segmentation I I
Pack ice motion
1
Classification I
I 1
1
I
I
Concentration I
I Marginal ice motion I
1
I
Ice edge detection
J
1
I
Ice edge J
11.
motion
1
I
Display
I
1 Postscript file (for printer)
The overall structure of the IPAP system is illustrated in Fig. 1. The preprocessing
subsystem enables IPAP products to be georeferenced to UTM or UPS map projection,
and manually or automatically land-masked as appropriate. The display subsystem is
designed to ensure that the output is in a form that is of direct use to the operators. To
date, IPAP products have been transmitted to the operators by facsimile, optionally
annotated with a latitude-longitude grid. In the following sections, each of the main
product areas within the system will be reviewed.
Table 1. IPAP Operator Requirements
Product
Ice type and concentration
Ice edge
Ice motion
Iceberg detection
Enhanced SAR imagery
(speckle-suppressed and
contrast enhanced)
Fig.1. Ice Pilot Application Project (IPAP)
system level diagram
I
Areal coverage
(km)
150 x 300
150 x 300
150 x 300
240 x 240
(centered on rig)
150 x 300
I
~
Iceberg detection
I
II
I
A.J. SEPHTON AND K.C. PARTINGTON
Spatial sampling Temporal sampling
(m)
100
100
100
10
100
12 h
12 h
3 days
12 h
6h
1 ERS-l data
Pre-processing
I
I
.J..
Segmentation I I
Pack ice motion
1
Classification I
I 1
1
I
I
Concentration I
I Marginal ice motion I
1
I
Ice edge detection
J
1
I
Ice edge J
11.
motion
1
I
Display
I
1 Postscript file (for printer)
The overall structure of the IPAP system is illustrated in Fig. 1. The preprocessing
subsystem enables IPAP products to be georeferenced to UTM or UPS map projection,
and manually or automatically land-masked as appropriate. The display subsystem is
designed to ensure that the output is in a form that is of direct use to the operators. To
date, IPAP products have been transmitted to the operators by facsimile, optionally
annotated with a latitude-longitude grid. In the following sections, each of the main
product areas within the system will be reviewed.