

" The RADARSAT Geophysical Processor System
245
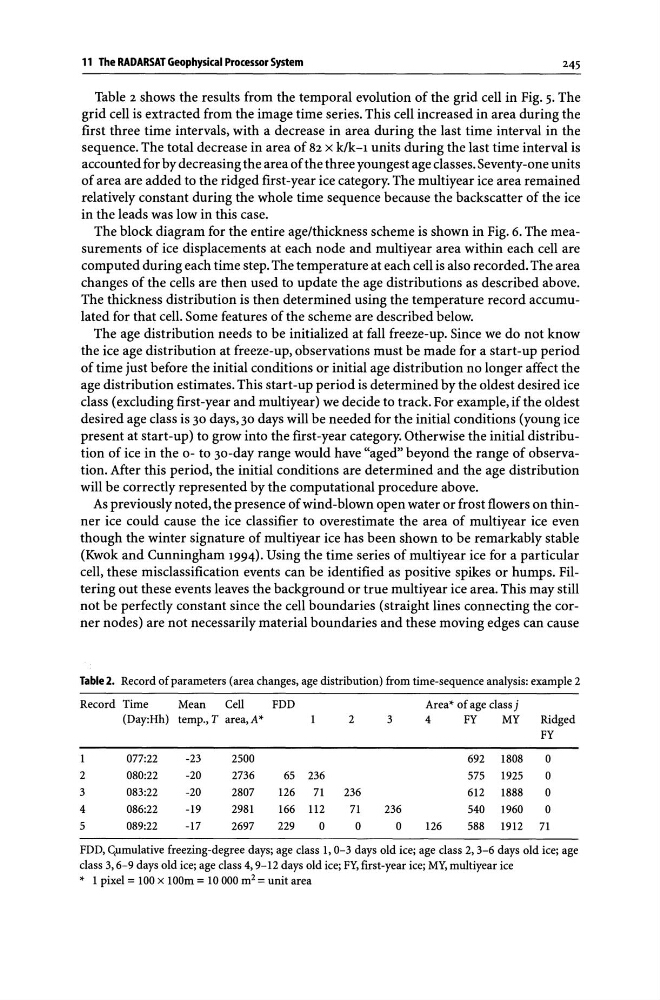
Table 2 shows the results from the temporal evolution of the grid cell in Fig. 5. The
grid cell is extracted from the image time series. This cell increased in area during the
first three time intervals, with a decrease in area during the last time interval in the
sequence. The total decrease in area of 82 x k/k-1 units during the last time interval is
accounted for by decreasing the area of the three youngest age classes. Seventy-one units
of area are added to the ridged first-year ice category. The multiyear ice area remained
relatively constant during the whole time sequence because the backscatter of the ice
in the leads was low in this case.
The block diagram for the entire age/thickness scheme is shown in Fig. 6. The measurements of ice displacements at each node and multiyear area within each cell are
computed during each time step. The temperature at each cell is also recorded. The area
changes of the cells are then used to update the age distributions as described above.
The thickness distribution is then determined using the temperature record accumulated for that cell. Some features of the scheme are described below.
The age distribution needs to be initialized at fall freeze-up. Since we do not know
the ice age distribution at freeze-up, observations must be made for a start-up period
of time just before the initial conditions or initial age distribution no longer affect the
age distribution estimates. This start-up period is determined by the oldest desired ice
class (excluding first -year and multiyear) we decide to track. For example, if the oldest
desired age class is 30 days, 30 days will be needed for the initial conditions (young ice
present at start-up) to grow into the first-year category. Otherwise the initial distribution of ice in the 0- to 30-day range would have "aged" beyond the range of observation. After this period, the initial conditions are determined and the age distribution
will be correctly represented by the computational procedure above.
As previously noted, the presence of wind-blown open water or frost flowers on thinner ice could cause the ice classifier to overestimate the area of multiyear ice even
though the winter signature of multiyear ice has been shown to be remarkably stable
(Kwok and Cunningham 1994). Using the time series of multiyear ice for a particular
cell, these misclassification events can be identified as positive spikes or humps. Filtering out these events leaves the background or true multiyear ice area. This may still
not be perfectly constant since the cell boundaries (straight lines connecting the corner nodes) are not necessarily material boundaries and these moving edges can cause
Table 2. Record of parameters (area changes, age distribution) from time-sequence analysis: example 2
Record Time
Mean
Cell
FDD
Area" of age class j
(Day:Hh) temp., T area, A"
2
3
4
FY
MY
Ridged
FY
077:22
-23
2500
692
1808
0
2
080:22
-20
2736
65 236
575
1925
0
3
083:22
-20
2807
126
71
236
612
1888
0
4
086:22
-19
2981
166 112
71
236
540
1960
0
5
089:22
-17
2697
229
0
0
0
126
588 1912
71
FDD, Cpmulative freezing-degree days; age class 1,0-3 days old ice; age class 2,3-6 days old ice; age
class 3,6-9 days old ice; age class 4, 9-12 days old ice; FY, first-year ice; MY, multiyear ice
" 1 pixel = 100 x 100m = lO 000 m 2 = unit area
245
Table 2 shows the results from the temporal evolution of the grid cell in Fig. 5. The
grid cell is extracted from the image time series. This cell increased in area during the
first three time intervals, with a decrease in area during the last time interval in the
sequence. The total decrease in area of 82 x k/k-1 units during the last time interval is
accounted for by decreasing the area of the three youngest age classes. Seventy-one units
of area are added to the ridged first-year ice category. The multiyear ice area remained
relatively constant during the whole time sequence because the backscatter of the ice
in the leads was low in this case.
The block diagram for the entire age/thickness scheme is shown in Fig. 6. The measurements of ice displacements at each node and multiyear area within each cell are
computed during each time step. The temperature at each cell is also recorded. The area
changes of the cells are then used to update the age distributions as described above.
The thickness distribution is then determined using the temperature record accumulated for that cell. Some features of the scheme are described below.
The age distribution needs to be initialized at fall freeze-up. Since we do not know
the ice age distribution at freeze-up, observations must be made for a start-up period
of time just before the initial conditions or initial age distribution no longer affect the
age distribution estimates. This start-up period is determined by the oldest desired ice
class (excluding first -year and multiyear) we decide to track. For example, if the oldest
desired age class is 30 days, 30 days will be needed for the initial conditions (young ice
present at start-up) to grow into the first-year category. Otherwise the initial distribution of ice in the 0- to 30-day range would have "aged" beyond the range of observation. After this period, the initial conditions are determined and the age distribution
will be correctly represented by the computational procedure above.
As previously noted, the presence of wind-blown open water or frost flowers on thinner ice could cause the ice classifier to overestimate the area of multiyear ice even
though the winter signature of multiyear ice has been shown to be remarkably stable
(Kwok and Cunningham 1994). Using the time series of multiyear ice for a particular
cell, these misclassification events can be identified as positive spikes or humps. Filtering out these events leaves the background or true multiyear ice area. This may still
not be perfectly constant since the cell boundaries (straight lines connecting the corner nodes) are not necessarily material boundaries and these moving edges can cause
Table 2. Record of parameters (area changes, age distribution) from time-sequence analysis: example 2
Record Time
Mean
Cell
FDD
Area" of age class j
(Day:Hh) temp., T area, A"
2
3
4
FY
MY
Ridged
FY
077:22
-23
2500
692
1808
0
2
080:22
-20
2736
65 236
575
1925
0
3
083:22
-20
2807
126
71
236
612
1888
0
4
086:22
-19
2981
166 112
71
236
540
1960
0
5
089:22
-17
2697
229
0
0
0
126
588 1912
71
FDD, Cpmulative freezing-degree days; age class 1,0-3 days old ice; age class 2,3-6 days old ice; age
class 3,6-9 days old ice; age class 4, 9-12 days old ice; FY, first-year ice; MY, multiyear ice
" 1 pixel = 100 x 100m = lO 000 m 2 = unit area