

11 The RADARSAT Geophysical Processor System
243
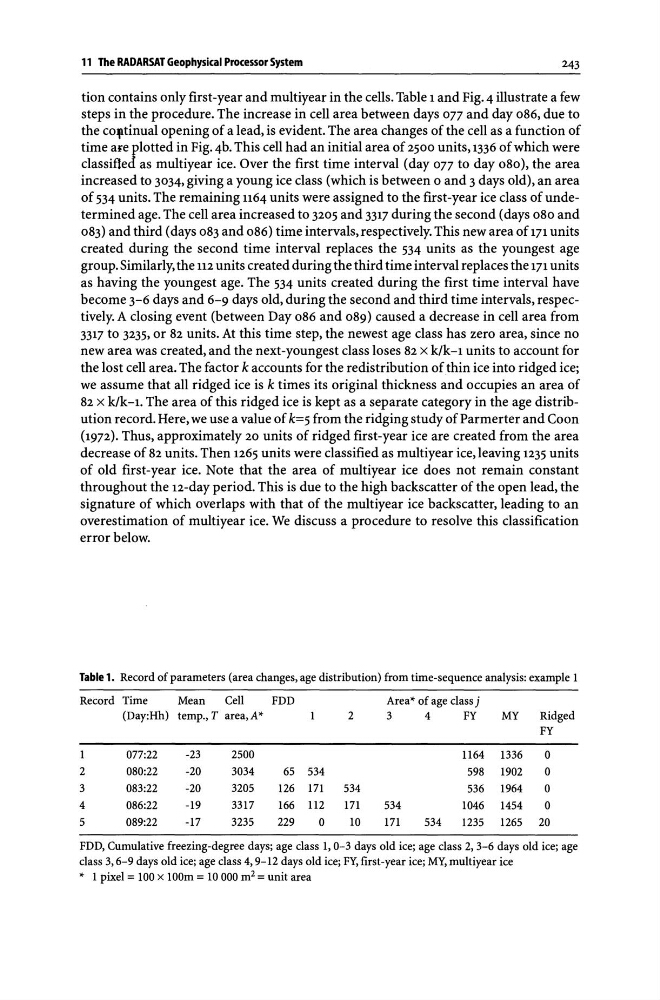
tion contains only first-year and multiyear in the cells. Table 1 and Fig. 4 illustrate a few
steps in the procedure. The increase in cell area between days 077 and day 086, due to
the co,tinual opening of a lead, is evident. The area changes of the cell as a function of
time are plotted in Fig. 4b. This cell had an initial area of 2500 units, 1336 of which were
classifled as multiyear ice. Over the first time interval (day 077 to day 080), the area
increased to 3034, giving a young ice class (which is between 0 and 3 days old), an area
of 534 units. The remaining 1164 units were assigned to the first-year ice class of undetermined age. The cell area increased to 3205 and 3317 during the second (days 080 and
083) and third (days 083 and 086) time intervals, respectively. This new area of 171 units
created during the second time interval replaces the 534 units as the youngest age
group. Similarly, the 112 units created during the third time interval replaces the 171 units
as having the youngest age. The 534 units created during the first time interval have
become 3-6 days and 6-9 days old, during the second and third time intervals, respectively. A closing event (between Day 086 and 089) caused a decrease in cell area from
3317 to 3235, or 82 units. At this time step, the newest age class has zero area, since no
new area was created, and the next-youngest class loses 82 x k/k-1 units to account for
the lost cell area. The factor k accounts for the redistribution of thin ice into ridged ice;
we assume that all ridged ice is k times its original thickness and occupies an area of
82 x k/k-1. The area of this ridged ice is kept as a separate category in the age distribution record. Here, we use a value of k=5 from the ridging study of Parmerter and Coon
(1972). Thus, approximately 20 units of ridged first-year ice are created from the area
decrease of 82 units. Then 1265 units were classified as multiyear ice, leaving 1235 units
of old first-year ice. Note that the area of multiyear ice does not remain constant
throughout the 12-day period. This is due to the high backscatter of the open lead, the
signature of which overlaps with that of the multiyear ice backscatter, leading to an
overestimation of multiyear ice. We discuss a procedure to resolve this classification
error below.
Table 1. Record of parameters (area changes, age distribution) from time-sequence analysis: example 1
Record Time
Mean
Cell
FDD
Area * of age class j
(Day:Hh) temp., T area, A *
2
3
4
FY
MY
Ridged
FY
1
077:22
-23
2500
1164 1336
0
2
080:22
-20
3034
65 534
598
1902
0
3
083:22
-20
3205
126 17l
534
536 1964
0
4
086:22
-19
3317
166 112
171
534
1046 1454
0
5
089:22
-17
3235
229
0
10
17l
534
1235 1265 20
FDD, Cumulative freezing-degree days; age class 1,0-3 days old ice; age class 2,3-6 days old ice; age
class 3,6-9 days old ice; age class 4,9-12 days old ice; FY, first-year ice; MY, multiyear ice
* 1 pixel = 100 x 100m = 10000 m 2 = unit area
243
tion contains only first-year and multiyear in the cells. Table 1 and Fig. 4 illustrate a few
steps in the procedure. The increase in cell area between days 077 and day 086, due to
the co,tinual opening of a lead, is evident. The area changes of the cell as a function of
time are plotted in Fig. 4b. This cell had an initial area of 2500 units, 1336 of which were
classifled as multiyear ice. Over the first time interval (day 077 to day 080), the area
increased to 3034, giving a young ice class (which is between 0 and 3 days old), an area
of 534 units. The remaining 1164 units were assigned to the first-year ice class of undetermined age. The cell area increased to 3205 and 3317 during the second (days 080 and
083) and third (days 083 and 086) time intervals, respectively. This new area of 171 units
created during the second time interval replaces the 534 units as the youngest age
group. Similarly, the 112 units created during the third time interval replaces the 171 units
as having the youngest age. The 534 units created during the first time interval have
become 3-6 days and 6-9 days old, during the second and third time intervals, respectively. A closing event (between Day 086 and 089) caused a decrease in cell area from
3317 to 3235, or 82 units. At this time step, the newest age class has zero area, since no
new area was created, and the next-youngest class loses 82 x k/k-1 units to account for
the lost cell area. The factor k accounts for the redistribution of thin ice into ridged ice;
we assume that all ridged ice is k times its original thickness and occupies an area of
82 x k/k-1. The area of this ridged ice is kept as a separate category in the age distribution record. Here, we use a value of k=5 from the ridging study of Parmerter and Coon
(1972). Thus, approximately 20 units of ridged first-year ice are created from the area
decrease of 82 units. Then 1265 units were classified as multiyear ice, leaving 1235 units
of old first-year ice. Note that the area of multiyear ice does not remain constant
throughout the 12-day period. This is due to the high backscatter of the open lead, the
signature of which overlaps with that of the multiyear ice backscatter, leading to an
overestimation of multiyear ice. We discuss a procedure to resolve this classification
error below.
Table 1. Record of parameters (area changes, age distribution) from time-sequence analysis: example 1
Record Time
Mean
Cell
FDD
Area * of age class j
(Day:Hh) temp., T area, A *
2
3
4
FY
MY
Ridged
FY
1
077:22
-23
2500
1164 1336
0
2
080:22
-20
3034
65 534
598
1902
0
3
083:22
-20
3205
126 17l
534
536 1964
0
4
086:22
-19
3317
166 112
171
534
1046 1454
0
5
089:22
-17
3235
229
0
10
17l
534
1235 1265 20
FDD, Cumulative freezing-degree days; age class 1,0-3 days old ice; age class 2,3-6 days old ice; age
class 3,6-9 days old ice; age class 4,9-12 days old ice; FY, first-year ice; MY, multiyear ice
* 1 pixel = 100 x 100m = 10000 m 2 = unit area