

10 Polar SAR Data for Operational Sea Ice Mapping
Mean
Backscatter
Value (dB)
0
East Siberian Sea
"
"
-'0
!:t;X"
"+'Ie
*" ++
.. 1:
-IS
+ffl t 0
0 ..
D 0
"10
0
0
"1S
x=MY
+=FYR
o = FYS
0 = NI
o
Beaufort Sea
,o L-____ ~ ____ ~~ ______ _L~ _ _ _ _ _ L _ _ _ _ _ _ _ L _ __ _ ~
llSE
13SE
160E
175W
I!'CW
125W
IOOW
Longitude (deg)
225
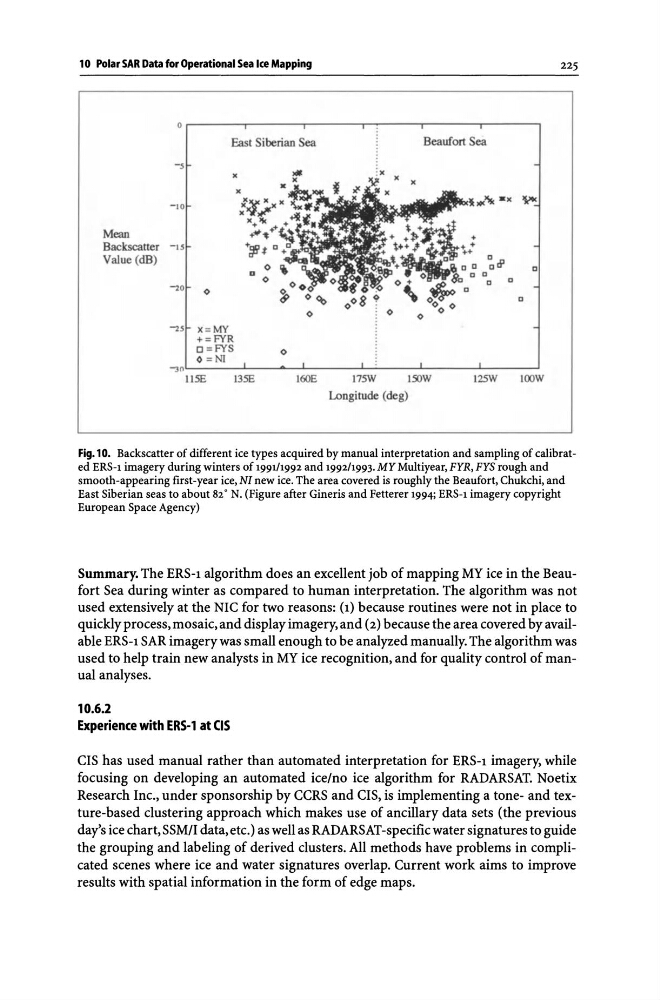
Fig. 10. Backscatter of different ice types acquired by manual interpretation and sampling of calibrated ERS-1 imagery during winters of 199111992 and 199211993. MY Multiyear, FYR, FYS rough and
smooth-appearing first-year ice, NI new ice. The area covered is roughly the Beaufort, Chukchi, and
East Siberian seas to about 82' N. (Figure after Gineris and Fetterer 1994; ERS-1 imagery copyright
European Space Agency)
Summary. The ERS-1 algorithm does an excellent job of mapping MY ice in the Beaufort Sea during winter as compared to human interpretation. The algorithm was not
used extensively at the Nrc for two reasons: (1) because routines were not in place to
quickly process, mosaic, and display imagery, and (2) because the area covered byavailable ERS-1 SAR imagery was small enough to be analyzed manually. The algorithm was
used to help train new analysts in MY ice recognition, and for quality control of manual analyses.
10.6.2
Experience with ERS-1 at CIS
CIS has used manual rather than automated interpretation for ERS-1 imagery, while
focusing on developing an automated ice!no ice algorithm for RADARSAT. Noetix
Research Inc., under sponsorship by CCRS and CIS, is implementing a tone- and texture-based clustering approach which makes use of ancillary data sets (the previous
day's ice chart, SSM!I data, etc.) as well as RADARSAT -specific water signatures to guide
the grouping and labeling of derived clusters. All methods have problems in complicated scenes where ice and water signatures overlap. Current work aims to improve
results with spatial information in the form of edge maps.
Mean
Backscatter
Value (dB)
0
East Siberian Sea
"
"
-'0
!:t;X"
"+'Ie
*" ++
.. 1:
-IS
+ffl t 0
0 ..
D 0
"10
0
0
"1S
x=MY
+=FYR
o = FYS
0 = NI
o
Beaufort Sea
,o L-____ ~ ____ ~~ ______ _L~ _ _ _ _ _ L _ _ _ _ _ _ _ L _ __ _ ~
llSE
13SE
160E
175W
I!'CW
125W
IOOW
Longitude (deg)
225
Fig. 10. Backscatter of different ice types acquired by manual interpretation and sampling of calibrated ERS-1 imagery during winters of 199111992 and 199211993. MY Multiyear, FYR, FYS rough and
smooth-appearing first-year ice, NI new ice. The area covered is roughly the Beaufort, Chukchi, and
East Siberian seas to about 82' N. (Figure after Gineris and Fetterer 1994; ERS-1 imagery copyright
European Space Agency)
Summary. The ERS-1 algorithm does an excellent job of mapping MY ice in the Beaufort Sea during winter as compared to human interpretation. The algorithm was not
used extensively at the Nrc for two reasons: (1) because routines were not in place to
quickly process, mosaic, and display imagery, and (2) because the area covered byavailable ERS-1 SAR imagery was small enough to be analyzed manually. The algorithm was
used to help train new analysts in MY ice recognition, and for quality control of manual analyses.
10.6.2
Experience with ERS-1 at CIS
CIS has used manual rather than automated interpretation for ERS-1 imagery, while
focusing on developing an automated ice!no ice algorithm for RADARSAT. Noetix
Research Inc., under sponsorship by CCRS and CIS, is implementing a tone- and texture-based clustering approach which makes use of ancillary data sets (the previous
day's ice chart, SSM!I data, etc.) as well as RADARSAT -specific water signatures to guide
the grouping and labeling of derived clusters. All methods have problems in complicated scenes where ice and water signatures overlap. Current work aims to improve
results with spatial information in the form of edge maps.