

10 Polar SAR Data for Operational Sea Ice Mapping
211
F I CJH04
ICE CONCENTRATION
F I CJH 161
ICE CONCENTRATI ON
ICE CONDI TlON
1H19-10/10 S 7-8/10
ICE CONDITION
8B9-10/10S7-8/10
FORECAST CHART
lI!l4-6/10 81-3/10
FORECAST CHART
lID 4-6/1 0 8 1-3/10
FOR 1994.1 .281ool 1
FOR 1994.2.2 (ooZI
lNITIA.. 19S>U .26!OOlJ
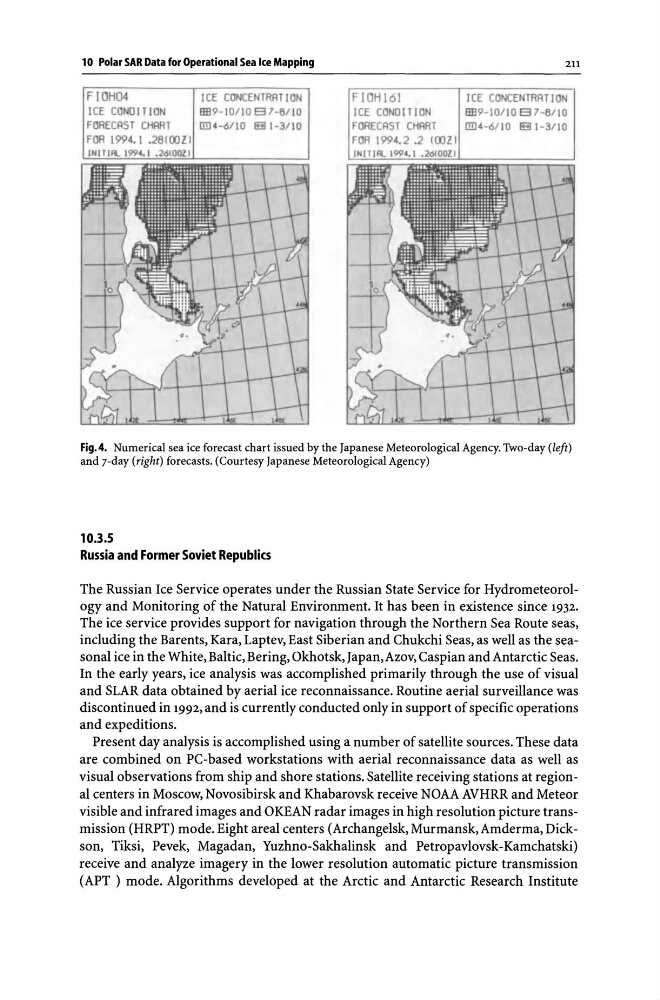
Fig.4. Numerical sea ice forecast chart issued by the Japanese Meteorological Agency. Two-day (left)
and 7-day (right) forecasts. (Courtesy Japanese Meteorological Agency)
10.3.5
Russia and Former Soviet Republics
The Russian Ice Service operates under the Russian State Service for Hydrometeorology and Monitoring of the Natural Environment. It has been in existence since 1932.
The ice service provides support for navigation through the Northern Sea Route seas,
including the Barents, Kara, Laptev, East Siberian and Chukchi Seas, as well as the seasonal ice in the White, Baltic, Bering, Okhotsk, Japan, Azov, Caspian and Antarctic Seas.
In the early years, ice analysis was accomplished primarily through the use of visual
and SLAR data obtained by aerial ice reconnaissance. Routine aerial surveillance was
discontinued in 1992, and is currently conducted only in support of specific operations
and expeditions.
Present day analysis is accomplished using a number of satellite sources. These data
are combined on PC-based workstations with aerial reconnaissance data as well as
visual observations from ship and shore stations. Satellite receiving stations at regional centers in Moscow, Novosibirsk and Khabarovsk receive NOAA AVHRR and Meteor
visible and infrared images and OKEAN radar images in high resolution picture transmission (HRPT) mode. Eight areal centers (Archangelsk, Murmansk, Amderma, Dickson, Tiksi, Pevek, Magadan, Yuzhno-Sakhalinsk and Petropavlovsk-Kamchatski)
receive and analyze imagery in the lower resolution automatic picture transmission
(APT ) mode. Algorithms developed at the Arctic and Antarctic Research Institute
211
F I CJH04
ICE CONCENTRATION
F I CJH 161
ICE CONCENTRATI ON
ICE CONDI TlON
1H19-10/10 S 7-8/10
ICE CONDITION
8B9-10/10S7-8/10
FORECAST CHART
lI!l4-6/10 81-3/10
FORECAST CHART
lID 4-6/1 0 8 1-3/10
FOR 1994.1 .281ool 1
FOR 1994.2.2 (ooZI
lNITIA.. 19S>U .26!OOlJ
Fig.4. Numerical sea ice forecast chart issued by the Japanese Meteorological Agency. Two-day (left)
and 7-day (right) forecasts. (Courtesy Japanese Meteorological Agency)
10.3.5
Russia and Former Soviet Republics
The Russian Ice Service operates under the Russian State Service for Hydrometeorology and Monitoring of the Natural Environment. It has been in existence since 1932.
The ice service provides support for navigation through the Northern Sea Route seas,
including the Barents, Kara, Laptev, East Siberian and Chukchi Seas, as well as the seasonal ice in the White, Baltic, Bering, Okhotsk, Japan, Azov, Caspian and Antarctic Seas.
In the early years, ice analysis was accomplished primarily through the use of visual
and SLAR data obtained by aerial ice reconnaissance. Routine aerial surveillance was
discontinued in 1992, and is currently conducted only in support of specific operations
and expeditions.
Present day analysis is accomplished using a number of satellite sources. These data
are combined on PC-based workstations with aerial reconnaissance data as well as
visual observations from ship and shore stations. Satellite receiving stations at regional centers in Moscow, Novosibirsk and Khabarovsk receive NOAA AVHRR and Meteor
visible and infrared images and OKEAN radar images in high resolution picture transmission (HRPT) mode. Eight areal centers (Archangelsk, Murmansk, Amderma, Dickson, Tiksi, Pevek, Magadan, Yuzhno-Sakhalinsk and Petropavlovsk-Kamchatski)
receive and analyze imagery in the lower resolution automatic picture transmission
(APT ) mode. Algorithms developed at the Arctic and Antarctic Research Institute