

10 Polar SAR Data for Operational Sea Ice Mapping
207
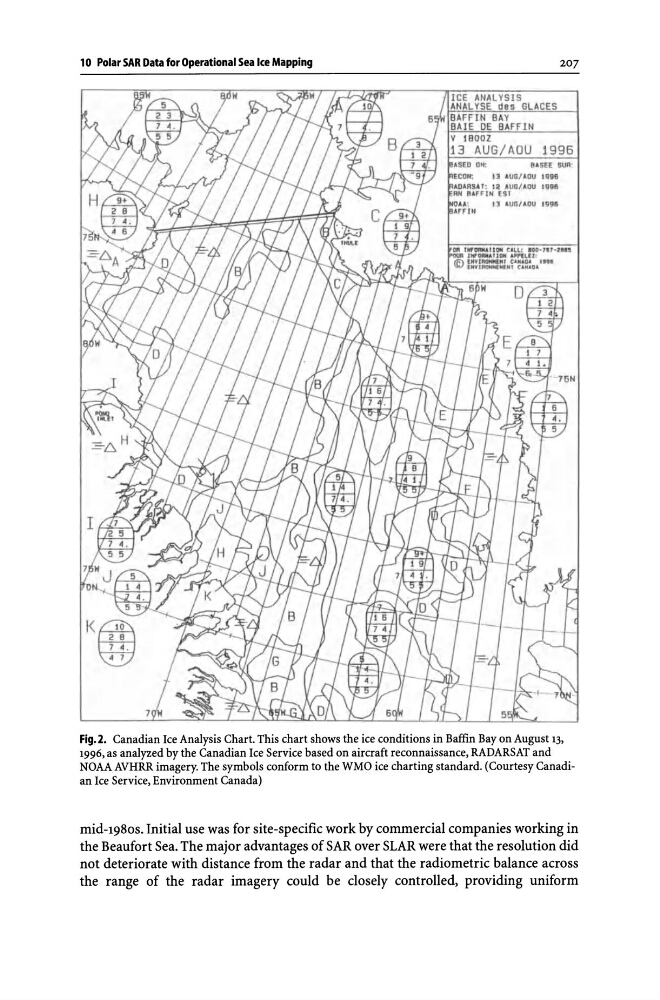
Fig. 2. Canadian Ice Analysis Chart. This chart shows the ice conditions in Baffin Bay on August 13,
1996, as analyzed by the Canadian Ice Service based on aircraft reconnaissance, RADARSAT and
NOAA AVHRR imagery. The symbols conform to the WMO ice charting standard. (Courtesy Canadian Ice Service, Environment Canada)
mid-198os. Initial use was for site-specific work by commercial companies working in
the Beaufort Sea. The major advantages of SAR over SLAR were that the resolution did
not deteriorate with distance from the radar and that the radiometric balance across
the range of the radar imagery could be closely controlled, providing uniform
207
Fig. 2. Canadian Ice Analysis Chart. This chart shows the ice conditions in Baffin Bay on August 13,
1996, as analyzed by the Canadian Ice Service based on aircraft reconnaissance, RADARSAT and
NOAA AVHRR imagery. The symbols conform to the WMO ice charting standard. (Courtesy Canadian Ice Service, Environment Canada)
mid-198os. Initial use was for site-specific work by commercial companies working in
the Beaufort Sea. The major advantages of SAR over SLAR were that the resolution did
not deteriorate with distance from the radar and that the radiometric balance across
the range of the radar imagery could be closely controlled, providing uniform