

10 Polar SAR Data for Operational Sea Ice Mapping
205
(GIS) software package, where vector and raster ice products are produced. During the
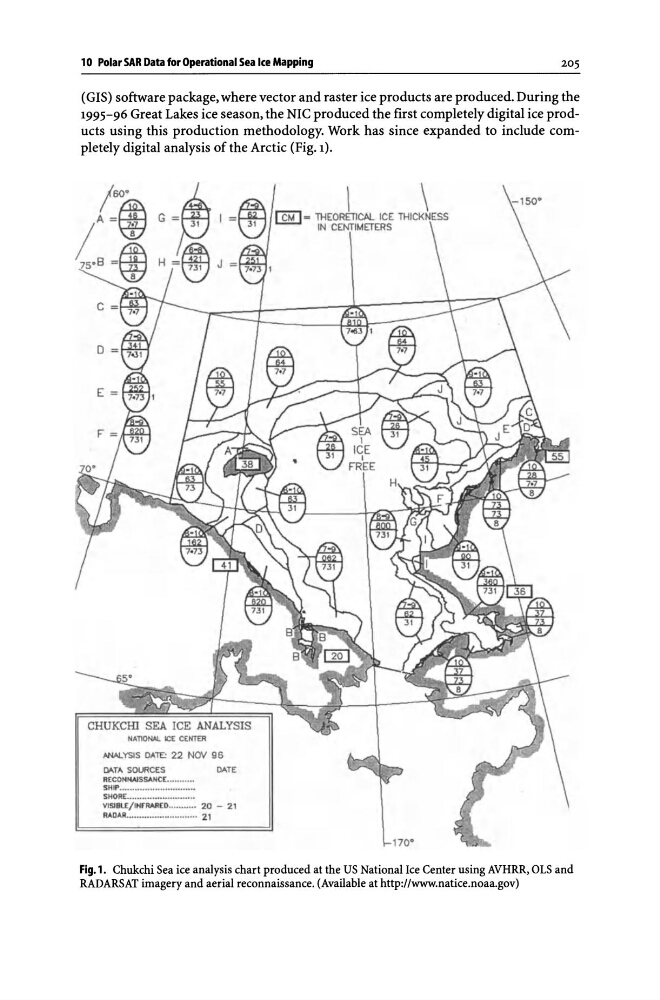
1995-96 Great Lakes ice season, the NIC produced the first completely digital ice products using this production methodology. Work has since expanded to include completely digital analysis of the Arctic (Fig. 1).
c
o
NATlONAL 'ICE CENTE'R
.o.NAl. YSIS OATE: 22 NOV 96
Ll'.TA SOURCES
DATE
RECOH ...... SSAMC[ ......... ..
SHtfI .............................•
SHORE ........•..•.•.•... u •.••••
V'SlBl£/'NrRMcO........... 20 - 21
..... 0 . ............................. 21
170·
Fig.l. Chukchi Sea ice analysis chart produced at the US National Ice Center using AVHRR, OLS and
RADARSAT imagery and aerial reconnaissance. (Available at http://www.natice.noaa.gov)
205
(GIS) software package, where vector and raster ice products are produced. During the
1995-96 Great Lakes ice season, the NIC produced the first completely digital ice products using this production methodology. Work has since expanded to include completely digital analysis of the Arctic (Fig. 1).
c
o
NATlONAL 'ICE CENTE'R
.o.NAl. YSIS OATE: 22 NOV 96
Ll'.TA SOURCES
DATE
RECOH ...... SSAMC[ ......... ..
SHtfI .............................•
SHORE ........•..•.•.•... u •.••••
V'SlBl£/'NrRMcO........... 20 - 21
..... 0 . ............................. 21
170·
Fig.l. Chukchi Sea ice analysis chart produced at the US National Ice Center using AVHRR, OLS and
RADARSAT imagery and aerial reconnaissance. (Available at http://www.natice.noaa.gov)