

180
M.R. DRINKWATER
pling and the sampling interval over which ice floes are tracked. The best solution
appears to be 3-day SAR ice-motion tracking at regular, exact I-day intervals, but issues
such as the SAR data volumes (for required coverage of the entire Weddell Sea) then
become paramount. RADARSAT ScanSAR image coverage may be the only future highresolution SAR solution which can approach this sampling requirement.
8.6.2
Temporal Changes in Ice Characteristics
The majority of algorithm problems occur as a consequence of large temporal variations in ice characteristics. Time series of ERS microwave radar data demonstrate that
within ice class backscatter signatures vary both seasonally and interannually in the
Weddell Sea. The primary distinction, therefore, between seasonal and perennial ice
covers can only be made by separating data acquired during the austral winter ice maximum and summer minimum, or alternatively by continuously tracking perennial ice
floes identified during the summer months through time and space. During February
and March of 1992, planned SAR acquisitions over ISW resulted in over 35 calibrated
images over this perennial ice zone region. Other, previously described winter SAR data
acquisitions were planned during WWGS' 92 in locations where R.Y. Polarstern was traveling across the Weddell Sea, and in a number of additional instrumented locations.
The result in 1992 is a total collection of more than 50 images (exceeding 3.5 x 109 pixels) in regions where sea-ice cover was either measured or for which independent
sources of information are available. Two examples of seasonal backscatter variability
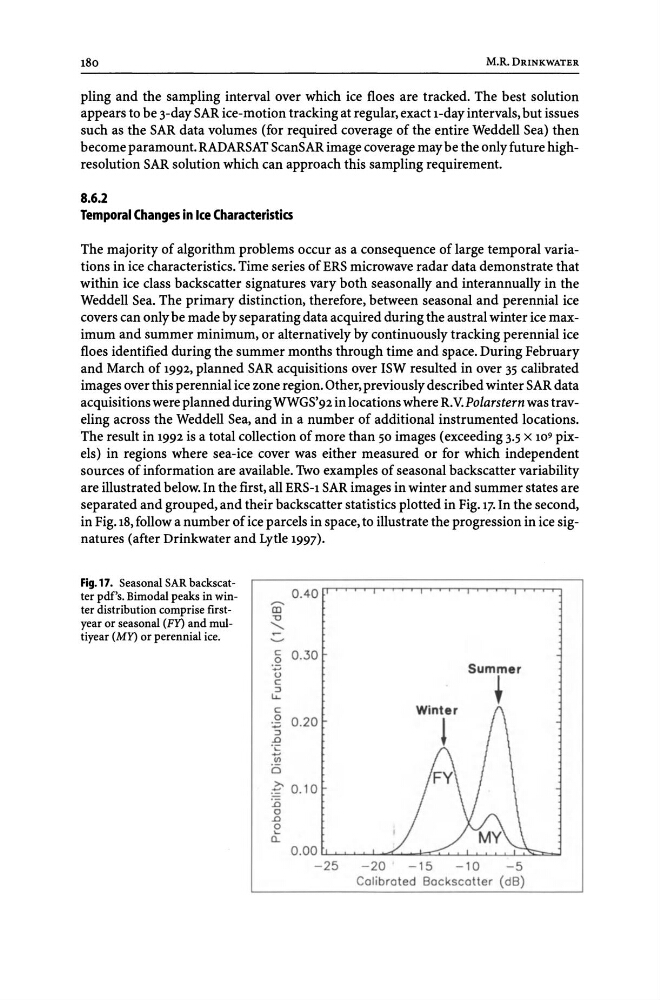
are illustrated below. In the first, all ERS-l SAR images in winter and summer states are
separated and grouped, and their backscatter statistics plotted in Fig. 17. In the second,
in Fig. 18, follow a number of ice parcels in space, to illustrate the progression in ice signatures (after Drinkwater and Lytle 1997).
Fig. 17. Seasonal SAR backscatter pdf's. Bimodal peaks in winter distribution comprise firstyear or seasonal (FY) and multiyear (MY) or perennial ice.
m
"
"'-"'
c
.2
U
c
::J
LL
C
0
:.::;
::J
.D
:s
If)
(5
£
:0
0
.D
e
0..
0.40
0 . .30
Summer
~
0.20
0.10
0.00
-25
- 20
-15
-10
-5
Calibrated Backscatter (dB)
M.R. DRINKWATER
pling and the sampling interval over which ice floes are tracked. The best solution
appears to be 3-day SAR ice-motion tracking at regular, exact I-day intervals, but issues
such as the SAR data volumes (for required coverage of the entire Weddell Sea) then
become paramount. RADARSAT ScanSAR image coverage may be the only future highresolution SAR solution which can approach this sampling requirement.
8.6.2
Temporal Changes in Ice Characteristics
The majority of algorithm problems occur as a consequence of large temporal variations in ice characteristics. Time series of ERS microwave radar data demonstrate that
within ice class backscatter signatures vary both seasonally and interannually in the
Weddell Sea. The primary distinction, therefore, between seasonal and perennial ice
covers can only be made by separating data acquired during the austral winter ice maximum and summer minimum, or alternatively by continuously tracking perennial ice
floes identified during the summer months through time and space. During February
and March of 1992, planned SAR acquisitions over ISW resulted in over 35 calibrated
images over this perennial ice zone region. Other, previously described winter SAR data
acquisitions were planned during WWGS' 92 in locations where R.Y. Polarstern was traveling across the Weddell Sea, and in a number of additional instrumented locations.
The result in 1992 is a total collection of more than 50 images (exceeding 3.5 x 109 pixels) in regions where sea-ice cover was either measured or for which independent
sources of information are available. Two examples of seasonal backscatter variability
are illustrated below. In the first, all ERS-l SAR images in winter and summer states are
separated and grouped, and their backscatter statistics plotted in Fig. 17. In the second,
in Fig. 18, follow a number of ice parcels in space, to illustrate the progression in ice signatures (after Drinkwater and Lytle 1997).
Fig. 17. Seasonal SAR backscatter pdf's. Bimodal peaks in winter distribution comprise firstyear or seasonal (FY) and multiyear (MY) or perennial ice.
m
"
"'-"'
c
.2
U
c
::J
LL
C
0
:.::;
::J
.D
:s
If)
(5
£
:0
0
.D
e
0..
0.40
0 . .30
Summer
~
0.20
0.10
0.00
-25
- 20
-15
-10
-5
Calibrated Backscatter (dB)