

8 Satellite Microwave Radar Observations of Antarctic Sea Ice
171
NOAA 10111 AVHRR
CH-4
10.-12.6.1992
10.8.-10.8 .1992
10.6.-11 .6.1992
11 .6.-12.8.1992
,ow
0.2 mi. -
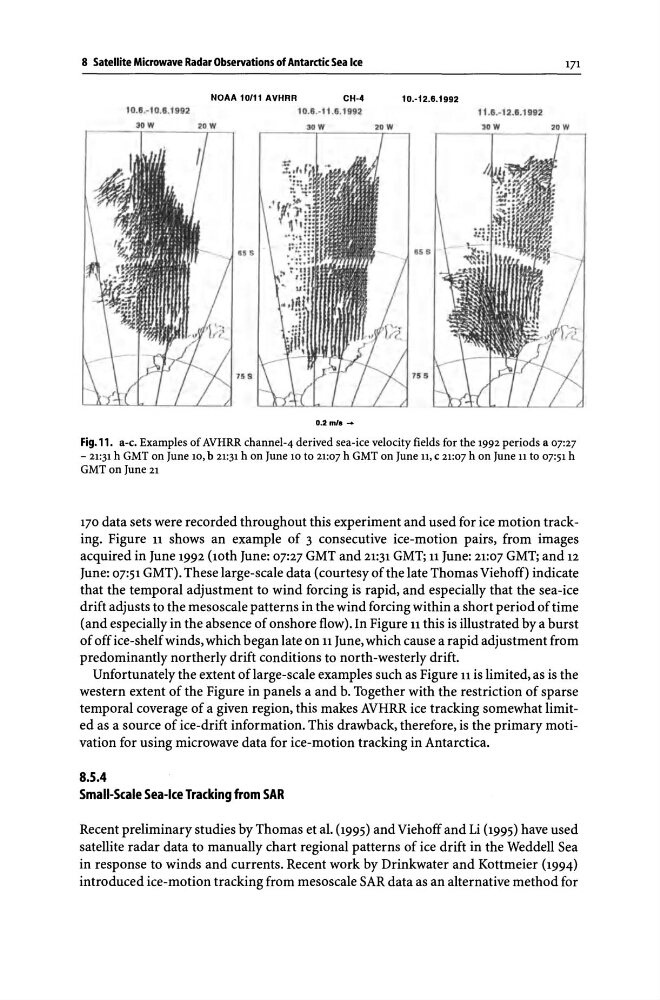
Fig.11. a-c. Examples of AVHRR channel-4 derived sea-ice velocity fields for the 1992 periods a 07:27
- 21:31 h GMT on June 10, b 21:31 h on June 10 to 21:07 h GMT on June 11, c 21:07 h on June 11 to 07:51 h
GMT on June 21
170 data sets were recorded throughout this experiment and used for ice motion tracking. Figure 11 shows an example of 3 consecutive ice-motion pairs, from images
acquired in June 1992 (10th June: 07:27 GMT and 21:31 GMT; 11 June: 21:07 GMT; and 12
June: 07:51 GMT). These large-scale data (courtesy of the late Thomas Viehoff) indicate
that the temporal adjustment to wind forcing is rapid, and especially that the sea-ice
drift adjusts to the mesoscale patterns in the wind forcing within a short period of time
(and especially in the absence of onshore flow)_ In Figure 11 this is illustrated by a burst
of off ice-shelf winds, which began late on 11 June, which cause a rapid adjustment from
predominantly northerly drift conditions to north-westerly drift.
Unfortunately the extent of large-scale examples such as Figure 11 is limited, as is the
western extent of the Figure in panels a and b. Together with the restriction of sparse
temporal coverage of a given region, this makes AVHRR ice tracking somewhat limited as a source of ice-drift information. This drawback, therefore, is the primary motivation for using microwave data for ice-motion tracking in Antarctica.
8.5.4
Small-Scale Sea-Ice Tracking from SAR
Recent preliminary studies by Thomas et al. (1995) and Viehoff and Li (1995) have used
satellite radar data to manually chart regional patterns of ice drift in the Weddell Sea
in response to winds and currents. Recent work by Drinkwater and Kottmeier (1994)
introduced ice-motion tracking from mesoscale SAR data as an alternative method for
171
NOAA 10111 AVHRR
CH-4
10.-12.6.1992
10.8.-10.8 .1992
10.6.-11 .6.1992
11 .6.-12.8.1992
,ow
0.2 mi. -
Fig.11. a-c. Examples of AVHRR channel-4 derived sea-ice velocity fields for the 1992 periods a 07:27
- 21:31 h GMT on June 10, b 21:31 h on June 10 to 21:07 h GMT on June 11, c 21:07 h on June 11 to 07:51 h
GMT on June 21
170 data sets were recorded throughout this experiment and used for ice motion tracking. Figure 11 shows an example of 3 consecutive ice-motion pairs, from images
acquired in June 1992 (10th June: 07:27 GMT and 21:31 GMT; 11 June: 21:07 GMT; and 12
June: 07:51 GMT). These large-scale data (courtesy of the late Thomas Viehoff) indicate
that the temporal adjustment to wind forcing is rapid, and especially that the sea-ice
drift adjusts to the mesoscale patterns in the wind forcing within a short period of time
(and especially in the absence of onshore flow)_ In Figure 11 this is illustrated by a burst
of off ice-shelf winds, which began late on 11 June, which cause a rapid adjustment from
predominantly northerly drift conditions to north-westerly drift.
Unfortunately the extent of large-scale examples such as Figure 11 is limited, as is the
western extent of the Figure in panels a and b. Together with the restriction of sparse
temporal coverage of a given region, this makes AVHRR ice tracking somewhat limited as a source of ice-drift information. This drawback, therefore, is the primary motivation for using microwave data for ice-motion tracking in Antarctica.
8.5.4
Small-Scale Sea-Ice Tracking from SAR
Recent preliminary studies by Thomas et al. (1995) and Viehoff and Li (1995) have used
satellite radar data to manually chart regional patterns of ice drift in the Weddell Sea
in response to winds and currents. Recent work by Drinkwater and Kottmeier (1994)
introduced ice-motion tracking from mesoscale SAR data as an alternative method for