

7 Mapping the Progression of Melt Onset and Freeze-Up
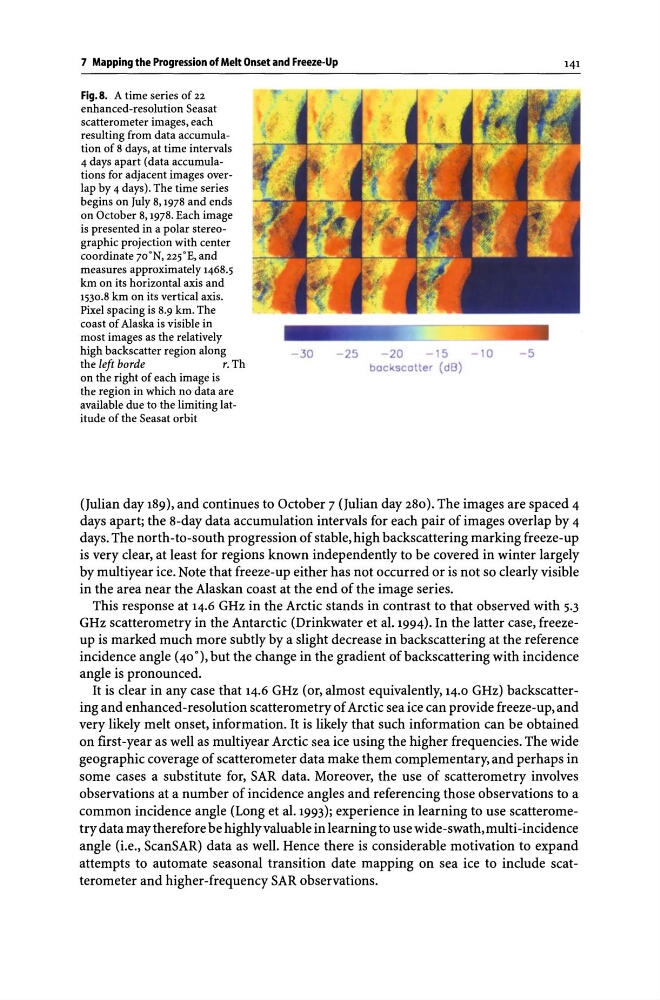
Fig. 8. A time series of 22
enhanced-resolution Seasat
scatterometer images, each
resulting from data accumulation of 8 days, at time intervals
4 days apart (data accumulations for adjacent images overlap by 4 days). The time series
begins on July 8, 1978 and ends
on October 8, 1978. Each image
is presented in a polar stereographic projection with center
coordinate 70"N, 225"E, and
measures approximately 1468.5
km on its horizontal axis and
1530.8 km on its vertical axis.
Pixel spacing is 8.9 km. The
coast of Alaska is visible in
most images as the relatively
high backscatter region along
the left borde
r. Th
on the right of each image is
the region in which no data are
available due to the limiting latitude of the Seasat orbit
- 30
- 25
- 20
-1 5
-10
backscatter (dB)
141
-5
(Julian day 189), and continues to October 7 (Julian day 280). The images are spaced 4
days apart; the 8-day data accumulation intervals for each pair of images overlap by 4
days. The north-to-south progression of stable, high backscattering marking freeze-up
is very clear, at least for regions known independently to be covered in winter largely
by multiyear ice. Note that freeze-up either has not occurred or is not so clearly visible
in the area near the Alaskan coast at the end of the image series.
This response at 14.6 GHz in the Arctic stands in contrast to that observed with 5.3
GHz scatterometry in the Antarctic (Drinkwater et al. 1994). In the latter case, freezeup is marked much more subtly by a slight decrease in backscattering at the reference
incidence angle (40 0 ) , but the change in the gradient of backscattering with incidence
angle is pronounced.
It is clear in any case that 14.6 GHz (or, almost equivalently, 14.0 GHz) backscattering and enhanced-resolution scatterometry of Arctic sea ice can provide freeze- up, and
very likely melt onset, information. It is likely that such information can be obtained
on first-year as well as multiyear Arctic sea ice using the higher frequencies. The wide
geographic coverage of scatterometer data make them complementary, and perhaps in
some cases a substitute for, SAR data. Moreover, the use of scatterometry involves
observations at a number of incidence angles and referencing those observations to a
common incidence angle (Long et al. 1993); experience in learning to use scatterometry data may therefore be highly valuable in learning to use wide-swath, multi -incidence
angle (i.e., ScanSAR) data as well. Hence there is considerable motivation to expand
attempts to automate seasonal transition date mapping on sea ice to include scatterometer and higher-frequency SAR observations.
Fig. 8. A time series of 22
enhanced-resolution Seasat
scatterometer images, each
resulting from data accumulation of 8 days, at time intervals
4 days apart (data accumulations for adjacent images overlap by 4 days). The time series
begins on July 8, 1978 and ends
on October 8, 1978. Each image
is presented in a polar stereographic projection with center
coordinate 70"N, 225"E, and
measures approximately 1468.5
km on its horizontal axis and
1530.8 km on its vertical axis.
Pixel spacing is 8.9 km. The
coast of Alaska is visible in
most images as the relatively
high backscatter region along
the left borde
r. Th
on the right of each image is
the region in which no data are
available due to the limiting latitude of the Seasat orbit
- 30
- 25
- 20
-1 5
-10
backscatter (dB)
141
-5
(Julian day 189), and continues to October 7 (Julian day 280). The images are spaced 4
days apart; the 8-day data accumulation intervals for each pair of images overlap by 4
days. The north-to-south progression of stable, high backscattering marking freeze-up
is very clear, at least for regions known independently to be covered in winter largely
by multiyear ice. Note that freeze-up either has not occurred or is not so clearly visible
in the area near the Alaskan coast at the end of the image series.
This response at 14.6 GHz in the Arctic stands in contrast to that observed with 5.3
GHz scatterometry in the Antarctic (Drinkwater et al. 1994). In the latter case, freezeup is marked much more subtly by a slight decrease in backscattering at the reference
incidence angle (40 0 ) , but the change in the gradient of backscattering with incidence
angle is pronounced.
It is clear in any case that 14.6 GHz (or, almost equivalently, 14.0 GHz) backscattering and enhanced-resolution scatterometry of Arctic sea ice can provide freeze- up, and
very likely melt onset, information. It is likely that such information can be obtained
on first-year as well as multiyear Arctic sea ice using the higher frequencies. The wide
geographic coverage of scatterometer data make them complementary, and perhaps in
some cases a substitute for, SAR data. Moreover, the use of scatterometry involves
observations at a number of incidence angles and referencing those observations to a
common incidence angle (Long et al. 1993); experience in learning to use scatterometry data may therefore be highly valuable in learning to use wide-swath, multi -incidence
angle (i.e., ScanSAR) data as well. Hence there is considerable motivation to expand
attempts to automate seasonal transition date mapping on sea ice to include scatterometer and higher-frequency SAR observations.