

6 Wavelet Analysis of SAR Images in the Marginal Ice Zone
121
edge by using the previous median scale results as the approximate boundary. The new
boundary points obtained by the small-scale wavelet transform may not be regularly
distributed near the approximate boundary, so that a running average of the coordinates
of these points may be necessary to facilitate the line linking as shown in Fig. 7b.
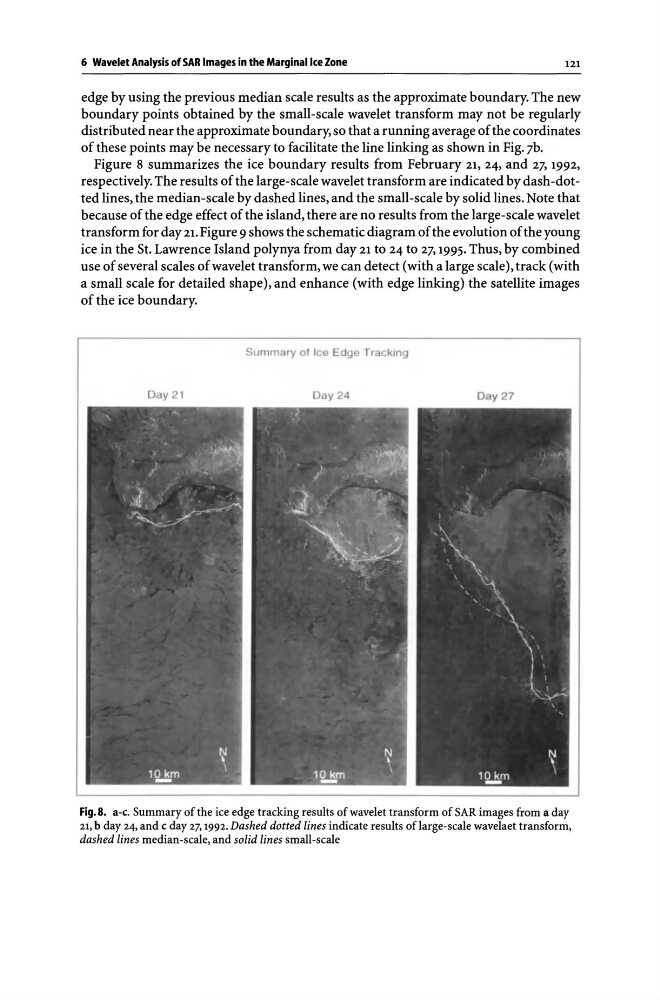
Figure 8 summarizes the ice boundary results from February 21, 24, and 27, 1992,
respectively. The results of the large-scale wavelet transform are indicated by dash -dotted lines, the median-scale by dashed lines, and the small-scale by solid lines. Note that
because of the edge effect of the island, there are no results from the large-scale wavelet
transform for day 21. Figure 9 shows the schematic diagram of the evolution of the young
ice in the St. Lawrence Island polynya from day 21 to 24 to 27,1995. Thus, by combined
use of several scales of wavelet transform, we can detect (with a large scale), track (with
a small scale for detailed shape), and enhance (with edge linking) the satellite images
of the ice boundary.
Summary of fce Edge Tracking
Day 21
Day 24
Day 27
Fig. 8. a-c. Summary of the ice edge tracking results of wavelet transform of SAR images from a day
21, b day 24, and c day 27, 1992. Dashed dotted lines indicate results of large-scale wavelaet transform,
dashed lines median-scale, and solid lines small-scale
121
edge by using the previous median scale results as the approximate boundary. The new
boundary points obtained by the small-scale wavelet transform may not be regularly
distributed near the approximate boundary, so that a running average of the coordinates
of these points may be necessary to facilitate the line linking as shown in Fig. 7b.
Figure 8 summarizes the ice boundary results from February 21, 24, and 27, 1992,
respectively. The results of the large-scale wavelet transform are indicated by dash -dotted lines, the median-scale by dashed lines, and the small-scale by solid lines. Note that
because of the edge effect of the island, there are no results from the large-scale wavelet
transform for day 21. Figure 9 shows the schematic diagram of the evolution of the young
ice in the St. Lawrence Island polynya from day 21 to 24 to 27,1995. Thus, by combined
use of several scales of wavelet transform, we can detect (with a large scale), track (with
a small scale for detailed shape), and enhance (with edge linking) the satellite images
of the ice boundary.
Summary of fce Edge Tracking
Day 21
Day 24
Day 27
Fig. 8. a-c. Summary of the ice edge tracking results of wavelet transform of SAR images from a day
21, b day 24, and c day 27, 1992. Dashed dotted lines indicate results of large-scale wavelaet transform,
dashed lines median-scale, and solid lines small-scale