

100
S.G. BEAVEN AND S.P. GOGINENI
centration are the result of misclassification of some multiyear ice as first-year ice, as
explained below.
Under summer melt conditions the frequency dependence of emissivity of multiyear
ice becomes similar to that of first-year ice (Cavalieri et al. 1984). Field measurements
of emissivity of multiyear ice obtained by Grenfell (1992) during the coordinated Eastern Arctic Research Experiment (CEAREX'88) demonstrate the change in spectral
response of emissivity as the temperature drops during the early stages of the freezeup season. The spectral response of multiyear ice is relatively flat. The emissivity difference between 19 GHz and 37 GHz becomes more pronounced as the freeze-up progresses. This results in the gradient ratio for multiyear ice moving from being similar
to first-year ice to cold multiyear ice. These field measurements showed that variations
in emissivity from multiyear ice during this season can vary anywhere between the firstyear and multiyear tie points of the NT algorithm as the freeze-up progresses.
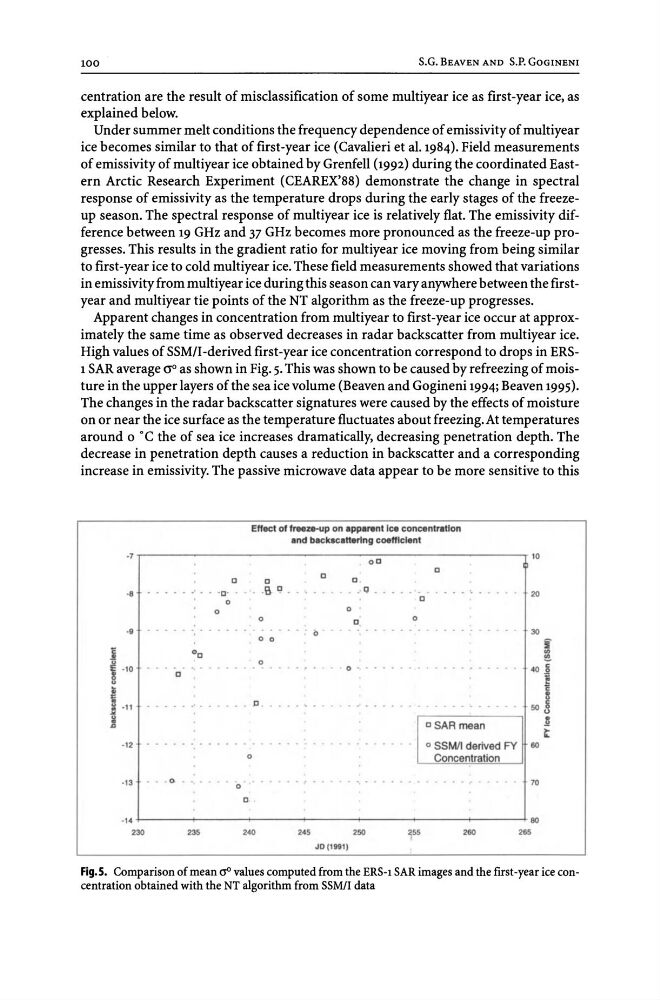
Apparent changes in concentration from multiyear to first-year ice occur at approximately the same time as observed decreases in radar backscatter from multiyear ice.
High values of SSM/I-derived first-year ice concentration correspond to drops in ERS1 SAR average 0'0 as shown in Fig. 5. This was shown to be caused by refreezing of moisture in the upper layers of the sea ice volume (Beaven and Gogineni 1994; Beaven 1995).
The changes in the radar backscatter signatures were caused by the effects of moisture
on or near the ice surface as the temperature fluctuates about freezing. At temperatures
around 0 ·C the of sea ice increases dramatically, decreasing penetration depth. The
decrease in penetration depth causes a reduction in backscatter and a corresponding
increase in emissivity. The passive microwave data appear to be more sensitive to this
Effecl ollree. Z8-up on Ipp .... nl Ic. concenl ... llon
end beck.celt.rlng coefflclenl
·7.---------------------------------------------------~IO
00
c
o
o
c
c
.S [J . • • • • • • • • . Q • • • • • • • • • • • ' • • •
o
20
·8
. • • • . . . . ·c · ..
o
o
o
o
o
c
·9
•• 00
30
o 0
iii
.,
e
o . . . . . • . • . . . . . - - - - - .
40 j
. . . . P . . . .
· 12
o
· 13
• - - 0. • " - - - • '0 '"
o .
i
5()8
.-----------,1 _8
c SAR mean
t:
o SSMII derived FY 6()
Concentration
70
. '4 -1-------->--------+-------+-------+-------+-------+--------+ 6()
~
~
~
~
~
~
- ~
JO('~11
Fig.S. Comparison of mean aD values computed from the ERS-I SAR images and the first-year ice concentration obtained with the NT algorithm from SSM!I data
S.G. BEAVEN AND S.P. GOGINENI
centration are the result of misclassification of some multiyear ice as first-year ice, as
explained below.
Under summer melt conditions the frequency dependence of emissivity of multiyear
ice becomes similar to that of first-year ice (Cavalieri et al. 1984). Field measurements
of emissivity of multiyear ice obtained by Grenfell (1992) during the coordinated Eastern Arctic Research Experiment (CEAREX'88) demonstrate the change in spectral
response of emissivity as the temperature drops during the early stages of the freezeup season. The spectral response of multiyear ice is relatively flat. The emissivity difference between 19 GHz and 37 GHz becomes more pronounced as the freeze-up progresses. This results in the gradient ratio for multiyear ice moving from being similar
to first-year ice to cold multiyear ice. These field measurements showed that variations
in emissivity from multiyear ice during this season can vary anywhere between the firstyear and multiyear tie points of the NT algorithm as the freeze-up progresses.
Apparent changes in concentration from multiyear to first-year ice occur at approximately the same time as observed decreases in radar backscatter from multiyear ice.
High values of SSM/I-derived first-year ice concentration correspond to drops in ERS1 SAR average 0'0 as shown in Fig. 5. This was shown to be caused by refreezing of moisture in the upper layers of the sea ice volume (Beaven and Gogineni 1994; Beaven 1995).
The changes in the radar backscatter signatures were caused by the effects of moisture
on or near the ice surface as the temperature fluctuates about freezing. At temperatures
around 0 ·C the of sea ice increases dramatically, decreasing penetration depth. The
decrease in penetration depth causes a reduction in backscatter and a corresponding
increase in emissivity. The passive microwave data appear to be more sensitive to this
Effecl ollree. Z8-up on Ipp .... nl Ic. concenl ... llon
end beck.celt.rlng coefflclenl
·7.---------------------------------------------------~IO
00
c
o
o
c
c
.S [J . • • • • • • • • . Q • • • • • • • • • • • ' • • •
o
20
·8
. • • • . . . . ·c · ..
o
o
o
o
o
c
·9
•• 00
30
o 0
iii
.,
e
o . . . . . • . • . . . . . - - - - - .
40 j
. . . . P . . . .
· 12
o
· 13
• - - 0. • " - - - • '0 '"
o .
i
5()8
.-----------,1 _8
c SAR mean
t:
o SSMII derived FY 6()
Concentration
70
. '4 -1-------->--------+-------+-------+-------+-------+--------+ 6()
~
~
~
~
~
~
- ~
JO('~11
Fig.S. Comparison of mean aD values computed from the ERS-I SAR images and the first-year ice concentration obtained with the NT algorithm from SSM!I data