

494
MARY ALTALO
take the information and adjust it for the operational area or other needs of
the user. Many companies, recognizing the importance of getting the
weather forecast “right” may actually buy “tailored” forecasts from several
vendors. In some instances they average them, in others they do a weighted
forecast (i.e. terrain dependent) to which they apply their own regional
knowledge as to the accuracy of the data. Other analytical services will
provide statistical analysis of the data in order to reduce the data error for the
operational area. The “refined” forecast is now inputted into the industry
“demand forecast” model, in this case load forecasting model for power
demand forecasting which takes a “day ahead” temperature forecast product
and uses a rolling average out to 7 days. Other inputs to this model are
market dynamics, present demand, yesterday’s demand, prices and
regulatory constraints, etc. The output is a demand forecast which is
converted into megawatts of generation to put on the electricity grid to meet
the demand. The generation scheduler then “buys” or commits the
generation from the various generators to meet the need and the “dispatch”
scheduler puts the power over the transmission lines to the end user. Other
operational decisions which are based on the demand forecast include
financial projections, power pricing, trading, etc. By effectively balancing
the load (supply=demand), the desired outcome of no fines, good profit
margin, increased reliability, decreased liability, etc. will follow. However,
when the weather error is large and the demand forecast is substantially off
leading to stresses on the system, fiscal loss, and possible threat of blackout
conditions. Thus getting the weather input right is of highest concern.
Environmental Information Flow on the
Environmental Information Flow on the
Operational Decision Process: Risk Reduction Areas
Operational Decision Process: Risk Reduction Areas
-
- scheduling and load bala ncing
scheduling and load balancing
-
- asset management and
asset management and
replacement
replacement
-
- enterprise wide contingency
enterprise wide contingency
and financial planning
and financial planning
-
- demand reduction and price
demand reduction and price
responsive loads
responsive loads
-
- environmental dispatch
environmental dispatch
-
- congestion management
congestion ma nagement
NMHS, Other
Providers,
GODAE
team
Metocean
Data and
Models
Value-Added
Service
Providers
Metocean
Data
Formatting
Weather Data Analysis
and IT Services:
Quantify, source, cost
and reduce weather data
error
Day Ahead
Week Ahead
Seasonal
Load Forecasting
Models
Metocean
Data
PreProcessing
DATA
INFORMATION
KNOWLEDGE
ACTION
OUTCOMES
IMPACTS
Load Model
Error Analysis:
Improve
Software and
Support
Economic/
Performance
Valuation of
Weather Error
Impacts
Decision
Analysis,
Dependencies
and Support
Tools
Metocean
Information
Integration
Metocean
Information
Evaluation
•Improved profit
•Increas ed Efficiency
•Improved reliability
•Increased safety
•Decreased Liability
•Decreased Risk
•Decreased Exposure
Metocean
Decision
Support
Operational Decisions
Outcomes
Situational Awareness Decision Support Optimal Response
Measured
Progress
Towards
Performance
Targets and
Development
Goals
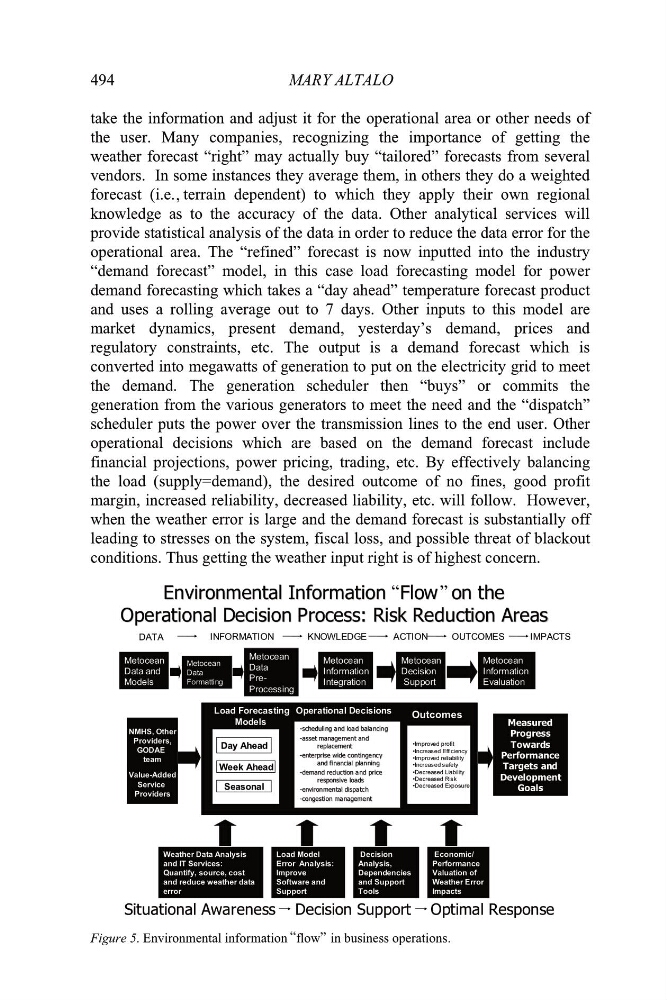
Figure 5. Environmental information flow in business operations.
,
“
”
”
“
MARY ALTALO
take the information and adjust it for the operational area or other needs of
the user. Many companies, recognizing the importance of getting the
weather forecast “right” may actually buy “tailored” forecasts from several
vendors. In some instances they average them, in others they do a weighted
forecast (i.e. terrain dependent) to which they apply their own regional
knowledge as to the accuracy of the data. Other analytical services will
provide statistical analysis of the data in order to reduce the data error for the
operational area. The “refined” forecast is now inputted into the industry
“demand forecast” model, in this case load forecasting model for power
demand forecasting which takes a “day ahead” temperature forecast product
and uses a rolling average out to 7 days. Other inputs to this model are
market dynamics, present demand, yesterday’s demand, prices and
regulatory constraints, etc. The output is a demand forecast which is
converted into megawatts of generation to put on the electricity grid to meet
the demand. The generation scheduler then “buys” or commits the
generation from the various generators to meet the need and the “dispatch”
scheduler puts the power over the transmission lines to the end user. Other
operational decisions which are based on the demand forecast include
financial projections, power pricing, trading, etc. By effectively balancing
the load (supply=demand), the desired outcome of no fines, good profit
margin, increased reliability, decreased liability, etc. will follow. However,
when the weather error is large and the demand forecast is substantially off
leading to stresses on the system, fiscal loss, and possible threat of blackout
conditions. Thus getting the weather input right is of highest concern.
Environmental Information Flow on the
Environmental Information Flow on the
Operational Decision Process: Risk Reduction Areas
Operational Decision Process: Risk Reduction Areas
-
- scheduling and load bala ncing
scheduling and load balancing
-
- asset management and
asset management and
replacement
replacement
-
- enterprise wide contingency
enterprise wide contingency
and financial planning
and financial planning
-
- demand reduction and price
demand reduction and price
responsive loads
responsive loads
-
- environmental dispatch
environmental dispatch
-
- congestion management
congestion ma nagement
NMHS, Other
Providers,
GODAE
team
Metocean
Data and
Models
Value-Added
Service
Providers
Metocean
Data
Formatting
Weather Data Analysis
and IT Services:
Quantify, source, cost
and reduce weather data
error
Day Ahead
Week Ahead
Seasonal
Load Forecasting
Models
Metocean
Data
PreProcessing
DATA
INFORMATION
KNOWLEDGE
ACTION
OUTCOMES
IMPACTS
Load Model
Error Analysis:
Improve
Software and
Support
Economic/
Performance
Valuation of
Weather Error
Impacts
Decision
Analysis,
Dependencies
and Support
Tools
Metocean
Information
Integration
Metocean
Information
Evaluation
•Improved profit
•Increas ed Efficiency
•Improved reliability
•Increased safety
•Decreased Liability
•Decreased Risk
•Decreased Exposure
Metocean
Decision
Support
Operational Decisions
Outcomes
Situational Awareness Decision Support Optimal Response
Measured
Progress
Towards
Performance
Targets and
Development
Goals
Figure 5. Environmental information flow in business operations.
,
“
”
”
“