

434
ANDREAS SCHILLER AND NEVILLE SMITH
The analyses for K, T and S are produced using ensemble-based multivariate
optimal interpolation (EMOI), which is based on simulated ensembles
produced by the model’s spin-up run. Modules from MOM4.0 are used to
convectively adjust gravitationally unstable temperature and salinity
profiles. The spatial filter is applied to eliminate near-grid-scale features in
the analysis increments. These modifications to the EMOI- based analyses
are made before the geostrophic adjustments are computed for u and v in an
attempt to construct dynamically balanced analyses. Further details about
BODAS can be found in Oke (2004, unpublished manuscript).
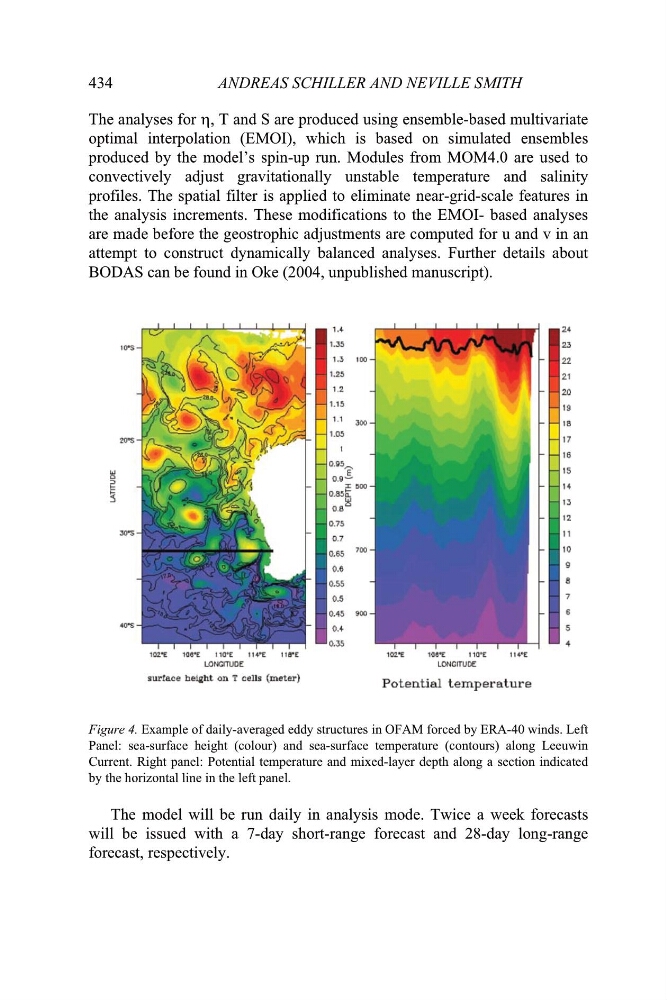
Figure 4. Example of daily-averaged eddy structures in OFAM forced by ERA-40 winds. Left
Panel: sea-surface height (colour) and sea-surface temperature (contours) along Leeuwin
Current. Right panel: Potential temperature and mixed-layer depth along a section indicated
by the horizontal line in the left panel.
The model will be run daily in analysis mode. Twice a week forecasts
will be issued with a 7-day short-range forecast and 28-day long-range
forecast, respectively.
ANDREAS SCHILLER AND NEVILLE SMITH
The analyses for K, T and S are produced using ensemble-based multivariate
optimal interpolation (EMOI), which is based on simulated ensembles
produced by the model’s spin-up run. Modules from MOM4.0 are used to
convectively adjust gravitationally unstable temperature and salinity
profiles. The spatial filter is applied to eliminate near-grid-scale features in
the analysis increments. These modifications to the EMOI- based analyses
are made before the geostrophic adjustments are computed for u and v in an
attempt to construct dynamically balanced analyses. Further details about
BODAS can be found in Oke (2004, unpublished manuscript).
Figure 4. Example of daily-averaged eddy structures in OFAM forced by ERA-40 winds. Left
Panel: sea-surface height (colour) and sea-surface temperature (contours) along Leeuwin
Current. Right panel: Potential temperature and mixed-layer depth along a section indicated
by the horizontal line in the left panel.
The model will be run daily in analysis mode. Twice a week forecasts
will be issued with a 7-day short-range forecast and 28-day long-range
forecast, respectively.