

HYCOM
421
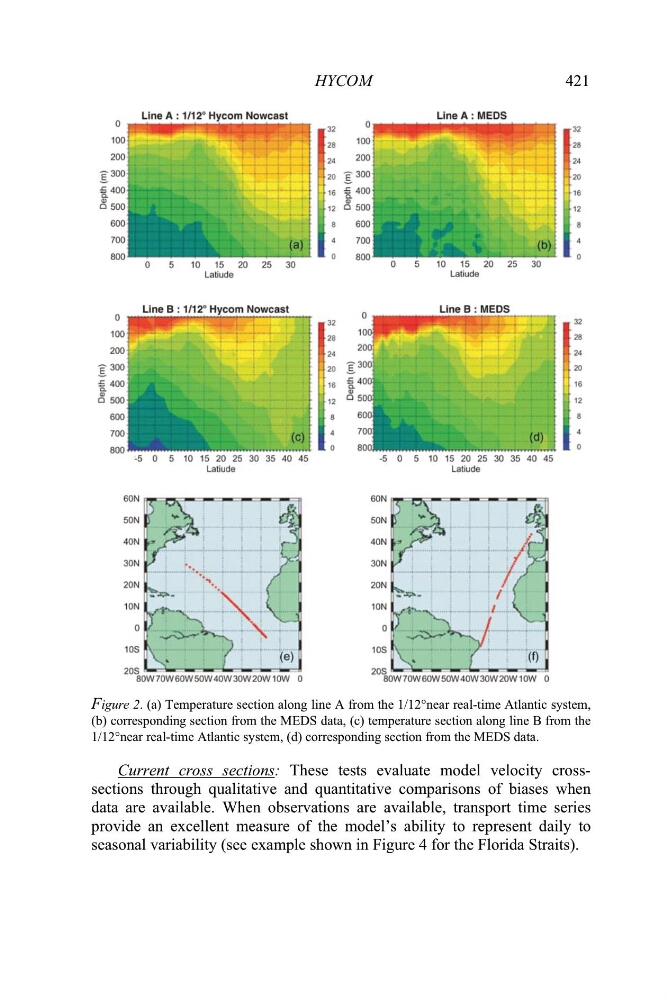
Figure 2. (a) Temperature section along line A from the 1/12°near real-time Atlantic system,
(b) corresponding section from the MEDS data, (c) temperature section along line B from the
1/12°near real-time Atlantic system, (d) corresponding section from the MEDS data.
Current cross sections: These tests evaluate model velocity crosssections through qualitative and quantitative comparisons of biases when
data are available. When observations are available, transport time series
provide an excellent measure of the model’s ability to represent daily to
seasonal variability (see example shown in Figure 4 for the Florida Straits).
421
Figure 2. (a) Temperature section along line A from the 1/12°near real-time Atlantic system,
(b) corresponding section from the MEDS data, (c) temperature section along line B from the
1/12°near real-time Atlantic system, (d) corresponding section from the MEDS data.
Current cross sections: These tests evaluate model velocity crosssections through qualitative and quantitative comparisons of biases when
data are available. When observations are available, transport time series
provide an excellent measure of the model’s ability to represent daily to
seasonal variability (see example shown in Figure 4 for the Florida Straits).