

FOAM
403
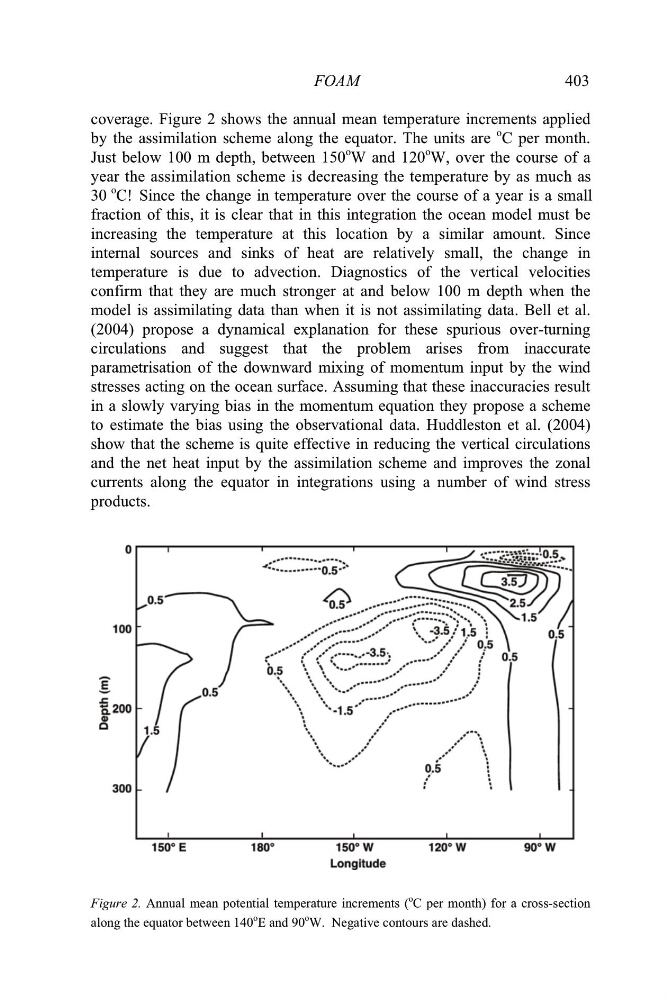
coverage. Figure 2 shows the annual mean temperature increments applied
by the assimilation scheme along the equator. The units are
o C per month.
Just below 100 m depth, between 150
o
W and 120
o W, over the course of a
o
fraction of this, it is clear that in this integration the ocean model must be
increasing the temperature at this location by a similar amount. Since
internal sources and sinks of heat are relatively small, the change in
temperature is due to advection. Diagnostics of the vertical velocities
confirm that they are much stronger at and below 100 m depth when the
model is assimilating data than when it is not assimilating data. Bell et al.
(2004) propose a dynamical explanation for these spurious over-turning
circulations and suggest that the problem arises from inaccurate
parametrisation of the downward mixing of momentum input by the wind
stresses acting on the ocean surface. Assuming that these inaccuracies result
in a slowly varying bias in the momentum equation they propose a scheme
to estimate the bias using the observational data. Huddleston et al. (2004)
show that the scheme is quite effective in reducing the vertical circulations
and the net heat input by the assimilation scheme and improves the zonal
currents along the equator in integrations using a number of wind stress
products.
Figure 2. Annual mean potential temperature increments (
o C per month) for a cross-section
along the equator between 140
o E and 90
o W. Negative contours are dashed.
year the assimilation scheme is decreasing the temperature by as much as
C!
30
Since the change in temperature over the course of a year is a small
403
coverage. Figure 2 shows the annual mean temperature increments applied
by the assimilation scheme along the equator. The units are
o C per month.
Just below 100 m depth, between 150
o
W and 120
o W, over the course of a
o
fraction of this, it is clear that in this integration the ocean model must be
increasing the temperature at this location by a similar amount. Since
internal sources and sinks of heat are relatively small, the change in
temperature is due to advection. Diagnostics of the vertical velocities
confirm that they are much stronger at and below 100 m depth when the
model is assimilating data than when it is not assimilating data. Bell et al.
(2004) propose a dynamical explanation for these spurious over-turning
circulations and suggest that the problem arises from inaccurate
parametrisation of the downward mixing of momentum input by the wind
stresses acting on the ocean surface. Assuming that these inaccuracies result
in a slowly varying bias in the momentum equation they propose a scheme
to estimate the bias using the observational data. Huddleston et al. (2004)
show that the scheme is quite effective in reducing the vertical circulations
and the net heat input by the assimilation scheme and improves the zonal
currents along the equator in integrations using a number of wind stress
products.
Figure 2. Annual mean potential temperature increments (
o C per month) for a cross-section
along the equator between 140
o E and 90
o W. Negative contours are dashed.
year the assimilation scheme is decreasing the temperature by as much as
C!
30
Since the change in temperature over the course of a year is a small