

THE ECMWF PERSPECTIVE
371
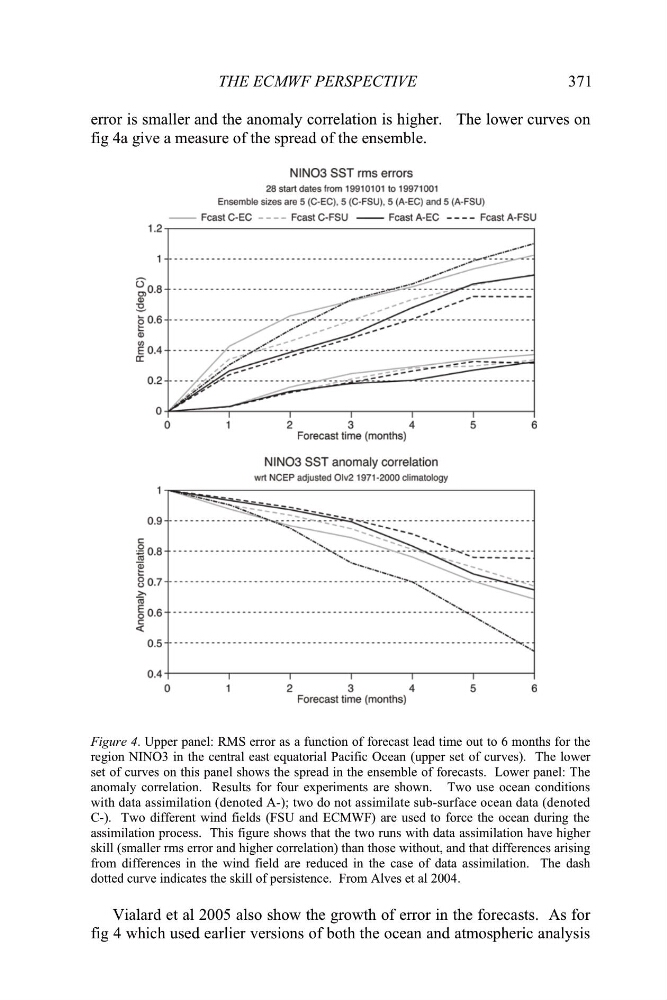
error is smaller and the anomaly correlation is higher. The lower curves on
fig 4a give a measure of the spread of the ensemble.
Figure 4. Upper panel: RMS error as a function of forecast lead time out to 6 months for the
region NINO3 in the central east equatorial Pacific Ocean (upper set of curves). The lower
set of curves on this panel shows the spread in the ensemble of forecasts. Lower panel: The
anomaly correlation. Results for four experiments are shown. Two use ocean conditions
assimilation process. This figure shows that the two runs with data assimilation have higher
skill (smaller rms error and higher correlation) than those without, and that differences arising
from differences in the wind field are reduced in the case of data assimilation. The dash
dotted curve indicates the skill of persistence. From Alves et al 2004.
Vialard et al 2005 also show the growth of error in the forecasts. As for
fig 4 which used earlier versions of both the ocean and atmospheric analysis
with data assimilation (denoted A-); two do not assimilate sub-surface ocean data (denoted
C-). Two different wind fields (FSU and ECMWF) are used to force the ocean during the
371
error is smaller and the anomaly correlation is higher. The lower curves on
fig 4a give a measure of the spread of the ensemble.
Figure 4. Upper panel: RMS error as a function of forecast lead time out to 6 months for the
region NINO3 in the central east equatorial Pacific Ocean (upper set of curves). The lower
set of curves on this panel shows the spread in the ensemble of forecasts. Lower panel: The
anomaly correlation. Results for four experiments are shown. Two use ocean conditions
assimilation process. This figure shows that the two runs with data assimilation have higher
skill (smaller rms error and higher correlation) than those without, and that differences arising
from differences in the wind field are reduced in the case of data assimilation. The dash
dotted curve indicates the skill of persistence. From Alves et al 2004.
Vialard et al 2005 also show the growth of error in the forecasts. As for
fig 4 which used earlier versions of both the ocean and atmospheric analysis
with data assimilation (denoted A-); two do not assimilate sub-surface ocean data (denoted
C-). Two different wind fields (FSU and ECMWF) are used to force the ocean during the