

368
DAVID ANDERSON ET AL
60°S
60°S
60°S
60°S
30°S
30°S
30°S
30°S
0°
0°
0°
0°
30°N
30°N
30°N
30°N
60°N
60°N
60°N
60°N
60°E
60°E
60°E
60°E
120°E
120°E
120°E
120°E
180°
180°
180°
180°
120°W
120°W
120°W
120°W
60°W
60°W
60°W
60°W
0°
0°
0°
0°
(10 days period centered on the 13th of november 2004)
Moorings: 1009 profiles
+ XBT probes: 853 profiles
Argo floats: 1561 profiles
Profile partially Accepted: 474 profiles
+ Full Profile Accepted: 1954 profiles
x Rejected Profile: 994 profiles
OBSERVATION COVERAGE:
QUALITY CONTROL:
OBSERVATION MONITORING
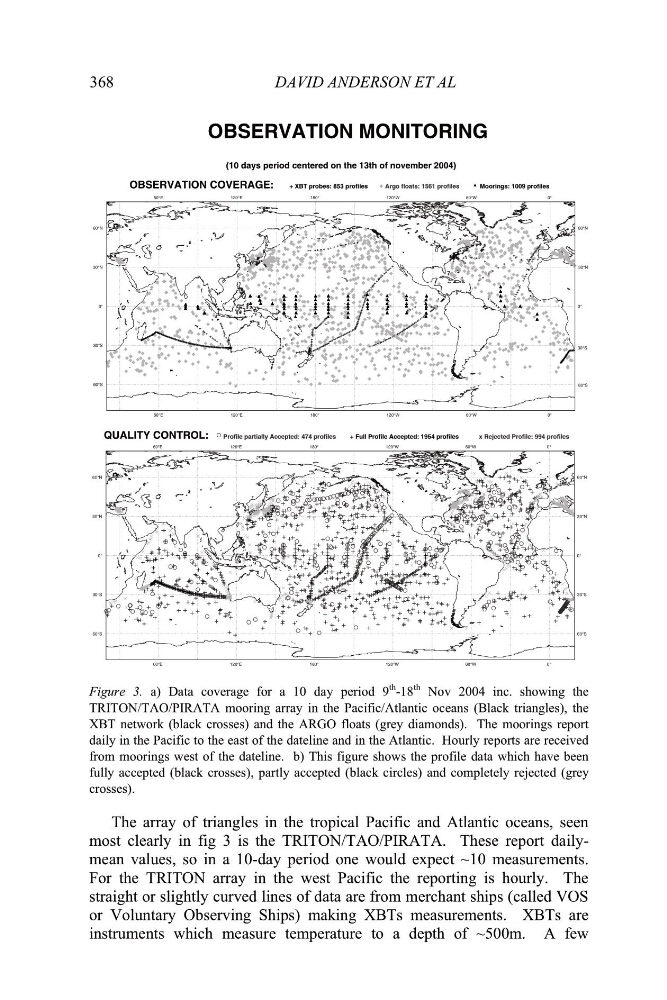
Figure 3. a) Data coverage for a 10 day period 9
th
-18
th Nov 2004 inc. showing the
TRITON/TAO/PIRATA mooring array in the Pacific/Atlantic oceans (Black triangles), the
XBT network (black crosses) and the ARGO floats (grey diamonds). The moorings report
daily in the Pacific to the east of the dateline and in the Atlantic. Hourly reports are received
from moorings west of the dateline. b) This figure shows the profile data which have been
fully accepted (black crosses), partly accepted (black circles) and completely rejected (grey
crosses).
The array of triangles in the tropical Pacific and Atlantic oceans, seen
most clearly in fig 3 is the TRITON/TAO/PIRATA. These report dailymean values, so in a 10-day period one would expect ~10 measurements.
For the TRITON array in the west Pacific the reporting is hourly. The
straight or slightly curved lines of data are from merchant ships (called VOS
or Voluntary Observing Ships) making XBTs measurements. XBTs are
instruments which measure temperature to a depth of ~500m. A few
DAVID ANDERSON ET AL
60°S
60°S
60°S
60°S
30°S
30°S
30°S
30°S
0°
0°
0°
0°
30°N
30°N
30°N
30°N
60°N
60°N
60°N
60°N
60°E
60°E
60°E
60°E
120°E
120°E
120°E
120°E
180°
180°
180°
180°
120°W
120°W
120°W
120°W
60°W
60°W
60°W
60°W
0°
0°
0°
0°
(10 days period centered on the 13th of november 2004)
Moorings: 1009 profiles
+ XBT probes: 853 profiles
Argo floats: 1561 profiles
Profile partially Accepted: 474 profiles
+ Full Profile Accepted: 1954 profiles
x Rejected Profile: 994 profiles
OBSERVATION COVERAGE:
QUALITY CONTROL:
OBSERVATION MONITORING
Figure 3. a) Data coverage for a 10 day period 9
th
-18
th Nov 2004 inc. showing the
TRITON/TAO/PIRATA mooring array in the Pacific/Atlantic oceans (Black triangles), the
XBT network (black crosses) and the ARGO floats (grey diamonds). The moorings report
daily in the Pacific to the east of the dateline and in the Atlantic. Hourly reports are received
from moorings west of the dateline. b) This figure shows the profile data which have been
fully accepted (black crosses), partly accepted (black circles) and completely rejected (grey
crosses).
The array of triangles in the tropical Pacific and Atlantic oceans, seen
most clearly in fig 3 is the TRITON/TAO/PIRATA. These report dailymean values, so in a 10-day period one would expect ~10 measurements.
For the TRITON array in the west Pacific the reporting is hourly. The
straight or slightly curved lines of data are from merchant ships (called VOS
or Voluntary Observing Ships) making XBTs measurements. XBTs are
instruments which measure temperature to a depth of ~500m. A few