

366
DAVID ANDERSON ET AL
of the eye, of the central pressure and of the structure both of the near and
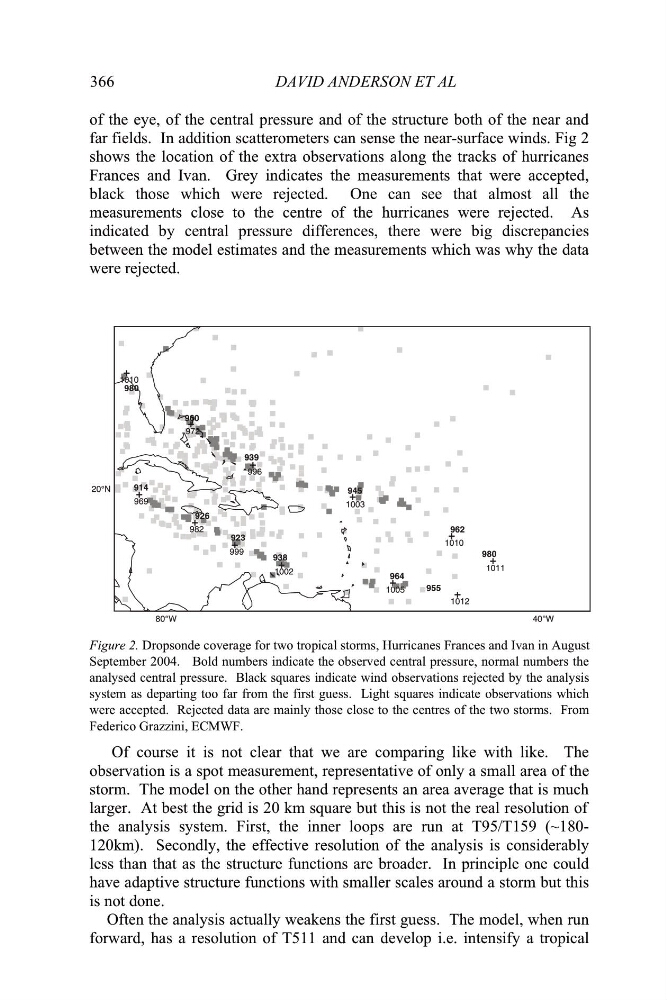
far fields. In addition scatterometers can sense the near-surface winds. Fig 2
shows the location of the extra observations along the tracks of hurricanes
Frances and Ivan. Grey indicates the measurements that were accepted,
black those which were rejected. One can see that almost all the
measurements close to the centre of the hurricanes were rejected. As
indicated by central pressure differences, there were big discrepancies
between the model estimates and the measurements which was why the data
were rejected.
1011
1010
1003
996
972
1005
1002
1010
999
1012
982
969
914
926
923
938
964
955
980
960
939
945
962
980
Figure 2. Dropsonde coverage for two tropical storms, Hurricanes Frances and Ivan in August
September 2004. Bold numbers indicate the observed central pressure, normal numbers the
analysed central pressure. Black squares indicate wind observations rejected by the analysis
system as departing too far from the first guess. Light squares indicate observations which
were accepted. Rejected data are mainly those close to the centres of the two storms. From
Federico Grazzini, ECMWF.
Of course it is not clear that we are comparing like with like. The
observation is a spot measurement, representative of only a small area of the
storm. The model on the other hand represents an area average that is much
the analysis system. First, the inner loops are run at T95/T159 (~180120km). Secondly, the effective resolution of the analysis is considerably
less than that as the structure functions are broader. In principle one could
have adaptive structure functions with smaller scales around a storm but this
is not done.
Often the analysis actually weakens the first guess. The model, when run
forward, has a resolution of T511 and can develop i.e. intensify a tropical
larger. At best the grid is 20 km square but this is not the real resolution of
DAVID ANDERSON ET AL
of the eye, of the central pressure and of the structure both of the near and
far fields. In addition scatterometers can sense the near-surface winds. Fig 2
shows the location of the extra observations along the tracks of hurricanes
Frances and Ivan. Grey indicates the measurements that were accepted,
black those which were rejected. One can see that almost all the
measurements close to the centre of the hurricanes were rejected. As
indicated by central pressure differences, there were big discrepancies
between the model estimates and the measurements which was why the data
were rejected.
1011
1010
1003
996
972
1005
1002
1010
999
1012
982
969
914
926
923
938
964
955
980
960
939
945
962
980
Figure 2. Dropsonde coverage for two tropical storms, Hurricanes Frances and Ivan in August
September 2004. Bold numbers indicate the observed central pressure, normal numbers the
analysed central pressure. Black squares indicate wind observations rejected by the analysis
system as departing too far from the first guess. Light squares indicate observations which
were accepted. Rejected data are mainly those close to the centres of the two storms. From
Federico Grazzini, ECMWF.
Of course it is not clear that we are comparing like with like. The
observation is a spot measurement, representative of only a small area of the
storm. The model on the other hand represents an area average that is much
the analysis system. First, the inner loops are run at T95/T159 (~180120km). Secondly, the effective resolution of the analysis is considerably
less than that as the structure functions are broader. In principle one could
have adaptive structure functions with smaller scales around a storm but this
is not done.
Often the analysis actually weakens the first guess. The model, when run
forward, has a resolution of T511 and can develop i.e. intensify a tropical
larger. At best the grid is 20 km square but this is not the real resolution of