

364
DAVID ANDERSON ET AL
100
%
90
80
70
60
50
40
30
0
1
2
3
4
5
Forecast day
6
7
8
9
10
100
%
90
80
70
60
50
40
20
30
0
1
2
3
4
5
Forecast day
6
7
8
9
1
Northern Hemisphere
Southern Hemisphere
0
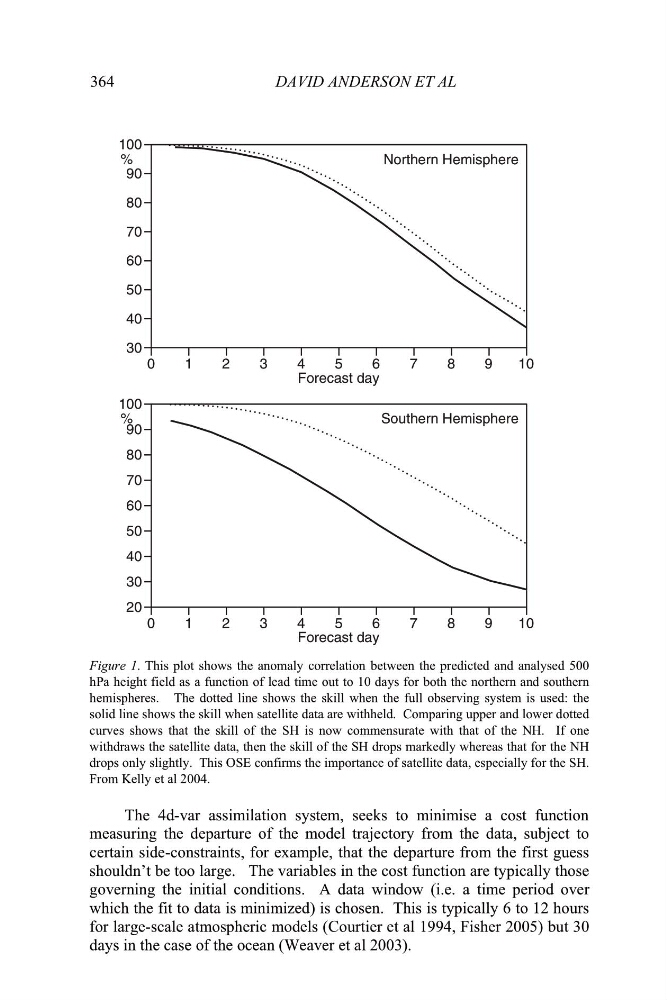
Figure 1. This plot shows the anomaly correlation between the predicted and analysed 500
hPa height field as a function of lead time out to 10 days for both the northern and southern
hemispheres. The dotted line shows the skill when the full observing system is used: the
solid line shows the skill when satellite data are withheld. Comparing upper and lower dotted
curves shows that the skill of the SH is now commensurate with that of the NH. If one
withdraws the satellite data, then the skill of the SH drops markedly whereas that for the NH
drops only slightly. This OSE confirms the importance of satellite data, especially for the SH.
From Kelly et al 2004.
The 4d-var assimilation system, seeks to minimise a cost function
measuring the departure of the model trajectory from the data, subject to
certain side-constraints, for example, that the departure from the first guess
shouldn’t be too large. The variables in the cost function are typically those
governing the initial conditions. A data window (i.e. a time period over
which the fit to data is minimized) is chosen. This is typically 6 to 12 hours
for large-scale atmospheric models (Courtier et al 1994, Fisher 2005) but 30
days in the case of the ocean (Weaver et al 2003).
DAVID ANDERSON ET AL
100
%
90
80
70
60
50
40
30
0
1
2
3
4
5
Forecast day
6
7
8
9
10
100
%
90
80
70
60
50
40
20
30
0
1
2
3
4
5
Forecast day
6
7
8
9
1
Northern Hemisphere
Southern Hemisphere
0
Figure 1. This plot shows the anomaly correlation between the predicted and analysed 500
hPa height field as a function of lead time out to 10 days for both the northern and southern
hemispheres. The dotted line shows the skill when the full observing system is used: the
solid line shows the skill when satellite data are withheld. Comparing upper and lower dotted
curves shows that the skill of the SH is now commensurate with that of the NH. If one
withdraws the satellite data, then the skill of the SH drops markedly whereas that for the NH
drops only slightly. This OSE confirms the importance of satellite data, especially for the SH.
From Kelly et al 2004.
The 4d-var assimilation system, seeks to minimise a cost function
measuring the departure of the model trajectory from the data, subject to
certain side-constraints, for example, that the departure from the first guess
shouldn’t be too large. The variables in the cost function are typically those
governing the initial conditions. A data window (i.e. a time period over
which the fit to data is minimized) is chosen. This is typically 6 to 12 hours
for large-scale atmospheric models (Courtier et al 1994, Fisher 2005) but 30
days in the case of the ocean (Weaver et al 2003).