

358
FLORENCE RABIER
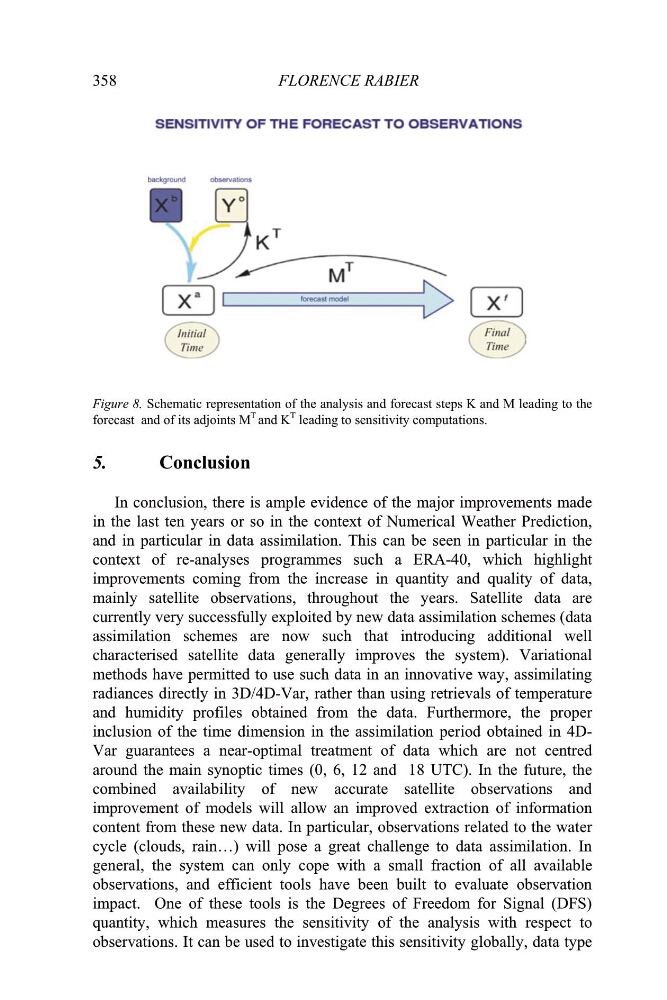
Figure 8 Schematic representation of the analysis and forecast steps K and M leading to the
forecast and of its adjoints M
T and K
T leading to sensitivity computations.
5.
Conclusion
In conclusion, there is ample evidence of the major improvements made
in the last ten years or so in the context of Numerical Weather Prediction,
and in particular in data assimilation. This can be seen in particular in the
context of re-analyses programmes such a ERA-40, which highlight
improvements coming from the increase in quantity and quality of data,
mainly satellite observations, throughout the years. Satellite data are
currently very successfully exploited by new data assimilation schemes (data
assimilation schemes are now such that introducing additional well
characterised satellite data generally improves the system). Variational
methods have permitted to use such data in an innovative way, assimilating
radiances directly in 3D/4D-Var, rather than using retrievals of temperature
and humidity profiles obtained from the data. Furthermore, the proper
inclusion of the time dimension in the assimilation period obtained in 4DVar guarantees a near-optimal treatment of data which are not centred
around the main synoptic times (0, 6, 12 and 18 UTC). In the future, the
combined availability of new accurate satellite observations and
improvement of models will allow an improved extraction of information
content from these new data. In particular, observations related to the water
cycle (clouds, rain…) will pose a great challenge to data assimilation. In
general, the system can only cope with a small fraction of all available
observations, and efficient tools have been built to evaluate observation
impact. One of these tools is the Degrees of Freedom for Signal (DFS)
quantity, which measures the sensitivity of the analysis with respect to
observations. It can be used to investigate this sensitivity globally, data type
.
FLORENCE RABIER
Figure 8 Schematic representation of the analysis and forecast steps K and M leading to the
forecast and of its adjoints M
T and K
T leading to sensitivity computations.
5.
Conclusion
In conclusion, there is ample evidence of the major improvements made
in the last ten years or so in the context of Numerical Weather Prediction,
and in particular in data assimilation. This can be seen in particular in the
context of re-analyses programmes such a ERA-40, which highlight
improvements coming from the increase in quantity and quality of data,
mainly satellite observations, throughout the years. Satellite data are
currently very successfully exploited by new data assimilation schemes (data
assimilation schemes are now such that introducing additional well
characterised satellite data generally improves the system). Variational
methods have permitted to use such data in an innovative way, assimilating
radiances directly in 3D/4D-Var, rather than using retrievals of temperature
and humidity profiles obtained from the data. Furthermore, the proper
inclusion of the time dimension in the assimilation period obtained in 4DVar guarantees a near-optimal treatment of data which are not centred
around the main synoptic times (0, 6, 12 and 18 UTC). In the future, the
combined availability of new accurate satellite observations and
improvement of models will allow an improved extraction of information
content from these new data. In particular, observations related to the water
cycle (clouds, rain…) will pose a great challenge to data assimilation. In
general, the system can only cope with a small fraction of all available
observations, and efficient tools have been built to evaluate observation
impact. One of these tools is the Degrees of Freedom for Signal (DFS)
quantity, which measures the sensitivity of the analysis with respect to
observations. It can be used to investigate this sensitivity globally, data type
.