

WILLIAM B. LARGE
I 1 9 B a s i n R u n o f f F l u x (mg/m2/s)
I , , , , ,
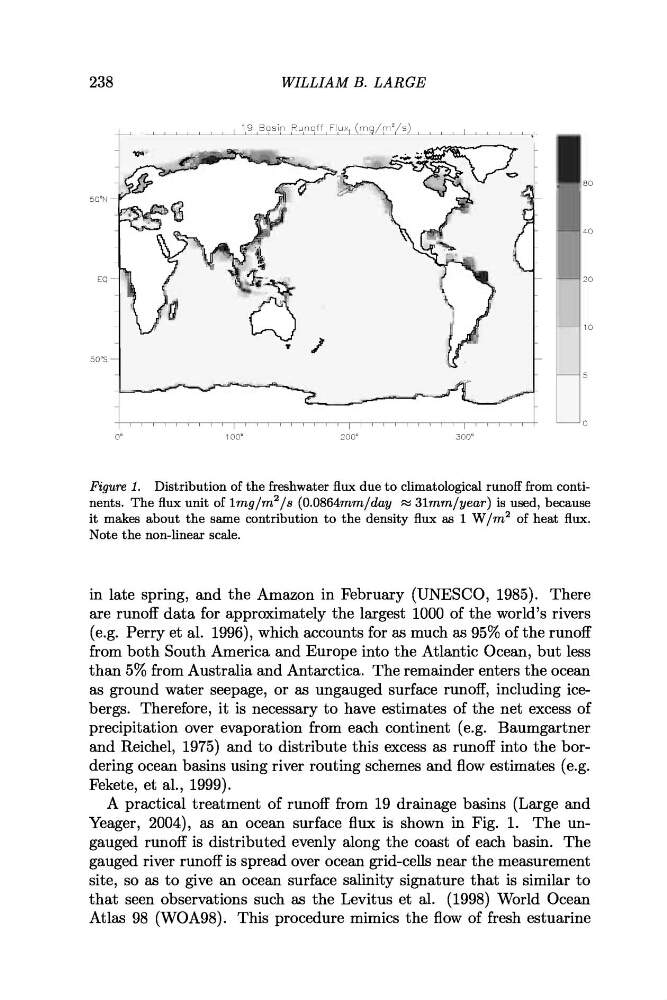
Figure 1. Distribution of the freshwater flux due to climatological runoff from continents. The flux unit of lmg/m2/s (0.0864mm/day FZ 3lmmlyear) is used, because
it makes about the same contribution to the density flux as 1 W / m 2 of heat flux.
Note the non-linear scale.
in late spring, and the Amazon in February (UNESCO, 1985). There
are runoff data for approximately the largest 1000 of the world's rivers
(e.g. Perry et al. 1996), which accounts for as much as 95% of the runoff
from both South America and Europe into the Atlantic Ocean, but less
than 5% from Australia and Antarctica. The remainder enters the ocean
as ground water seepage, or as ungauged surface runoff, including icebergs. Therefore, it is necessary to have estimates of the net excess of
precipitation over evaporation from each continent (e.g. Baumgartner
and Reichel, 1975) and to distribute this excess as runoff into the bordering ocean basins using river routing schemes and flow estimates (e.g.
Fekete, et al., 1999).
A practical treatment of runoff from 19 drainage basins (Large and
Yeager, 2004), as an ocean surface flux is shown in Fig. 1. The ungauged runoff is distributed evenly along the coast of each basin. The
gauged river runoff is spread over ocean grid-cells near the measurement
site, so as to give an ocean surface salinity signature that is similar to
that seen observations such as the Levitus et al. (1998) World Ocean
Atlas 98 (WOA98). This procedure mimics the flow of fresh estuarine
I 1 9 B a s i n R u n o f f F l u x (mg/m2/s)
I , , , , ,
Figure 1. Distribution of the freshwater flux due to climatological runoff from continents. The flux unit of lmg/m2/s (0.0864mm/day FZ 3lmmlyear) is used, because
it makes about the same contribution to the density flux as 1 W / m 2 of heat flux.
Note the non-linear scale.
in late spring, and the Amazon in February (UNESCO, 1985). There
are runoff data for approximately the largest 1000 of the world's rivers
(e.g. Perry et al. 1996), which accounts for as much as 95% of the runoff
from both South America and Europe into the Atlantic Ocean, but less
than 5% from Australia and Antarctica. The remainder enters the ocean
as ground water seepage, or as ungauged surface runoff, including icebergs. Therefore, it is necessary to have estimates of the net excess of
precipitation over evaporation from each continent (e.g. Baumgartner
and Reichel, 1975) and to distribute this excess as runoff into the bordering ocean basins using river routing schemes and flow estimates (e.g.
Fekete, et al., 1999).
A practical treatment of runoff from 19 drainage basins (Large and
Yeager, 2004), as an ocean surface flux is shown in Fig. 1. The ungauged runoff is distributed evenly along the coast of each basin. The
gauged river runoff is spread over ocean grid-cells near the measurement
site, so as to give an ocean surface salinity signature that is similar to
that seen observations such as the Levitus et al. (1998) World Ocean
Atlas 98 (WOA98). This procedure mimics the flow of fresh estuarine