

224
SYLVIE POULIQUEN
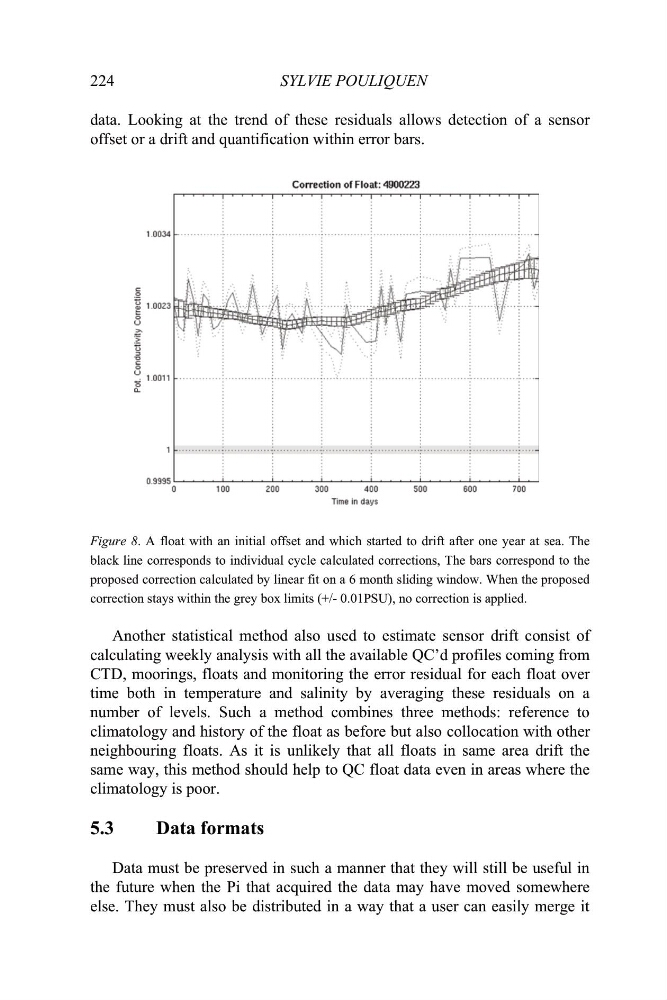
data. Looking at the trend of these residuals allows detection of a sensor
offset or a drift and quantification within error bars.
Figure 8. A float with an initial offset and which started to drift after one year at sea. The
black line corresponds to individual cycle calculated corrections, The bars correspond to the
proposed correction calculated by linear fit on a 6 month sliding window. When the proposed
correction stays within the grey box limits (+/- 0.01PSU), no correction is applied.
Another statistical method also used to estimate sensor drift consist of
calculating weekly analysis with all the available QC’d profiles coming from
CTD, moorings, floats and monitoring the error residual for each float over
time both in temperature and salinity by averaging these residuals on a
number of levels. Such a method combines three methods: reference to
climatology and history of the float as before but also collocation with other
neighbouring floats. As it is unlikely that all floats in same area drift the
same way, this method should help to QC float data even in areas where the
climatology is poor.
5.3
Data formats
Data must be preserved in such a manner that they will still be useful in
the future when the Pi that acquired the data may have moved somewhere
else. They must also be distributed in a way that a user can easily merge it
SYLVIE POULIQUEN
data. Looking at the trend of these residuals allows detection of a sensor
offset or a drift and quantification within error bars.
Figure 8. A float with an initial offset and which started to drift after one year at sea. The
black line corresponds to individual cycle calculated corrections, The bars correspond to the
proposed correction calculated by linear fit on a 6 month sliding window. When the proposed
correction stays within the grey box limits (+/- 0.01PSU), no correction is applied.
Another statistical method also used to estimate sensor drift consist of
calculating weekly analysis with all the available QC’d profiles coming from
CTD, moorings, floats and monitoring the error residual for each float over
time both in temperature and salinity by averaging these residuals on a
number of levels. Such a method combines three methods: reference to
climatology and history of the float as before but also collocation with other
neighbouring floats. As it is unlikely that all floats in same area drift the
same way, this method should help to QC float data even in areas where the
climatology is poor.
5.3
Data formats
Data must be preserved in such a manner that they will still be useful in
the future when the Pi that acquired the data may have moved somewhere
else. They must also be distributed in a way that a user can easily merge it