

194
UWE SEND
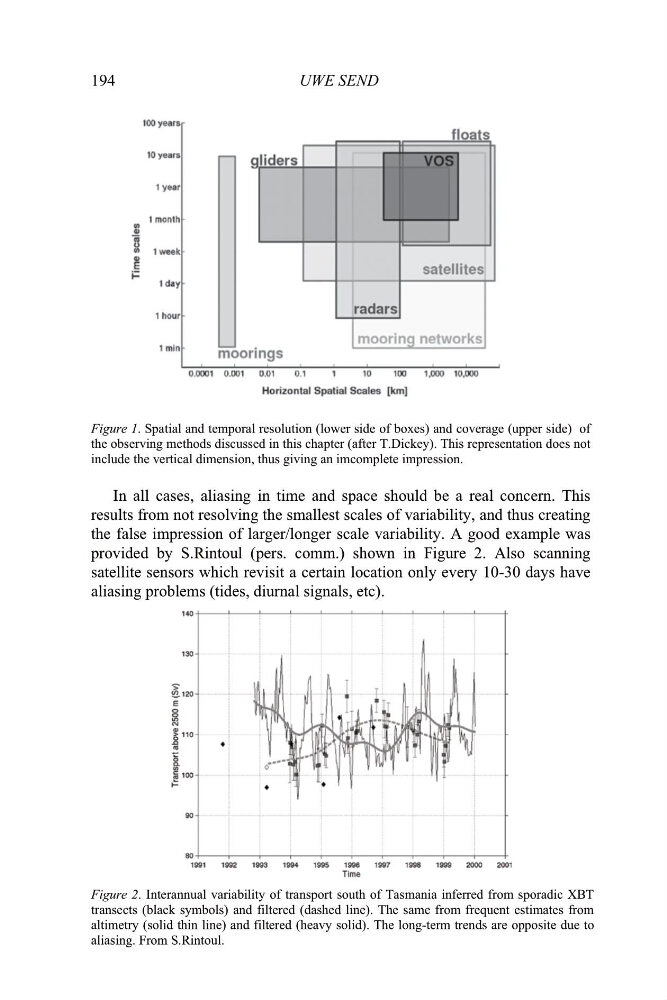
Figure 1. Spatial and temporal resolution (lower side of boxes) and coverage (upper side) of
the observing methods discussed in this chapter (after T.Dickey). This representation does not
include the vertical dimension, thus giving an imcomplete impression.
In all cases, aliasing in time and space should be a real concern. This
results from not resolving the smallest scales of variability, and thus creating
the false impression of larger/longer scale variability. A good example was
provided by S.Rintoul (pers. comm.) shown in Figure 2. Also scanning
satellite sensors which revisit a certain location only every 10-30 days have
aliasing problems (tides, diurnal signals, etc).
Figure 2. Interannual variability of transport south of Tasmania inferred from sporadic XBT
transects (black symbols) and filtered (dashed line). The same from frequent estimates from
altimetry (solid thin line) and filtered (heavy solid). The long-term trends are opposite due to
aliasing. From S.Rintoul.
UWE SEND
Figure 1. Spatial and temporal resolution (lower side of boxes) and coverage (upper side) of
the observing methods discussed in this chapter (after T.Dickey). This representation does not
include the vertical dimension, thus giving an imcomplete impression.
In all cases, aliasing in time and space should be a real concern. This
results from not resolving the smallest scales of variability, and thus creating
the false impression of larger/longer scale variability. A good example was
provided by S.Rintoul (pers. comm.) shown in Figure 2. Also scanning
satellite sensors which revisit a certain location only every 10-30 days have
aliasing problems (tides, diurnal signals, etc).
Figure 2. Interannual variability of transport south of Tasmania inferred from sporadic XBT
transects (black symbols) and filtered (dashed line). The same from frequent estimates from
altimetry (solid thin line) and filtered (heavy solid). The long-term trends are opposite due to
aliasing. From S.Rintoul.