

SATELLITE MEASUREMENTS
151
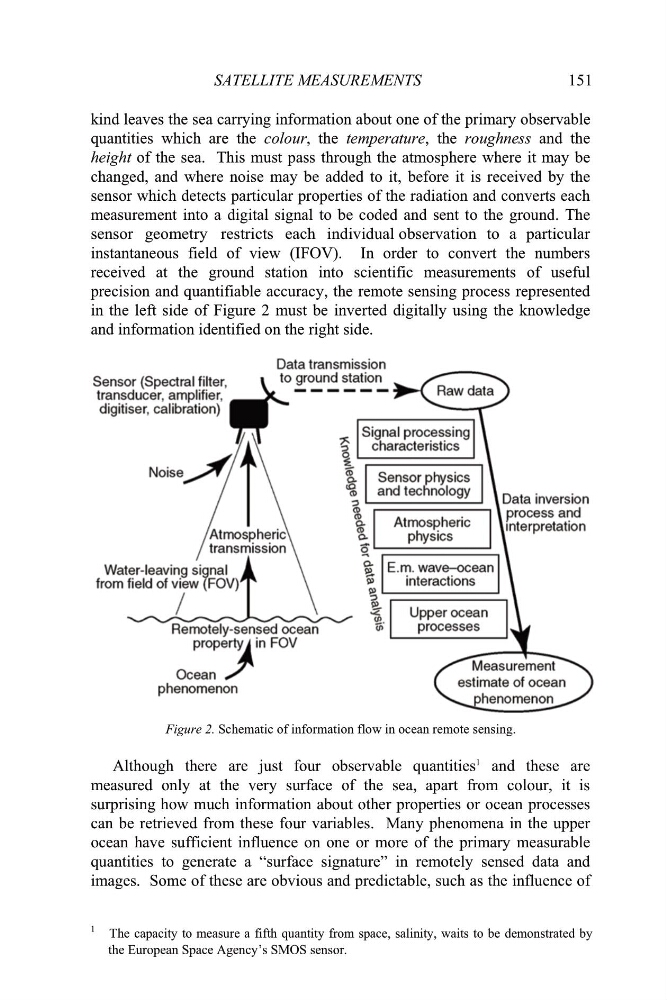
kind leaves the sea carrying information about one of the primary observable
quantities which are the colour, the temperature, the roughness and the
height of the sea. This must pass through the atmosphere where it may be
changed, and where noise may be added to it, before it is received by the
sensor which detects particular properties of the radiation and converts each
measurement into a digital signal to be coded and sent to the ground. The
sensor geometry restricts each individual observation to a particular
instantaneous field of view (IFOV). In order to convert the numbers
received at the ground station into scientific measurements of useful
precision and quantifiable accuracy, the remote sensing process represented
in the left side of Figure 2 must be inverted digitally using the knowledge
and information identified on the right side.
Figure 2. Schematic of information flow in ocean remote sensing.
Although there are just four observable quantities
1 and these are
measured only at the very surface of the sea, apart from colour, it is
surprising how much information about other properties or ocean processes
can be retrieved from these four variables. Many phenomena in the upper
ocean have sufficient influence on one or more of the primary measurable
quantities to generate a “surface signature” in remotely sensed data and
images. Some of these are obvious and predictable, such as the influence of
1
The capacity to measure a fifth quantity from space, salinity, waits to be demonstrated by
the European Space Agency’s SMOS sensor.
151
kind leaves the sea carrying information about one of the primary observable
quantities which are the colour, the temperature, the roughness and the
height of the sea. This must pass through the atmosphere where it may be
changed, and where noise may be added to it, before it is received by the
sensor which detects particular properties of the radiation and converts each
measurement into a digital signal to be coded and sent to the ground. The
sensor geometry restricts each individual observation to a particular
instantaneous field of view (IFOV). In order to convert the numbers
received at the ground station into scientific measurements of useful
precision and quantifiable accuracy, the remote sensing process represented
in the left side of Figure 2 must be inverted digitally using the knowledge
and information identified on the right side.
Figure 2. Schematic of information flow in ocean remote sensing.
Although there are just four observable quantities
1 and these are
measured only at the very surface of the sea, apart from colour, it is
surprising how much information about other properties or ocean processes
can be retrieved from these four variables. Many phenomena in the upper
ocean have sufficient influence on one or more of the primary measurable
quantities to generate a “surface signature” in remotely sensed data and
images. Some of these are obvious and predictable, such as the influence of
1
The capacity to measure a fifth quantity from space, salinity, waits to be demonstrated by
the European Space Agency’s SMOS sensor.