

3.17 Exercise 10: Slope Convection near the Shore
67
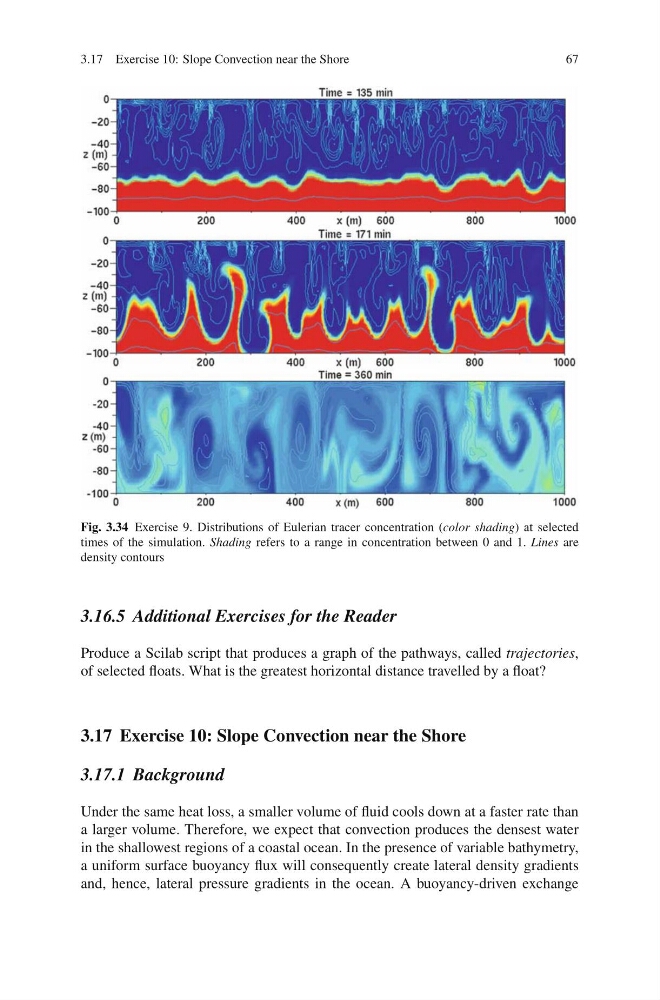
Fig. 3.34 Exercise 9. Distributions of Eulerian tracer concentration (color shading) at selected
times of the simulation. Shading refers to a range in concentration between 0 and 1. Lines are
density contours
3.16.5 Additional Exercises for the Reader
Produce a Scilab script that produces a graph of the pathways, called trajectories,
of selected floats. What is the greatest horizontal distance travelled by a float?
3.17 Exercise 10: Slope Convection near the Shore
3.17.1 Background
Under the same heat loss, a smaller volume of fluid cools down at a faster rate than
a larger volume. Therefore, we expect that convection produces the densest water
in the shallowest regions of a coastal ocean. In the presence of variable bathymetry,
a uniform surface buoyancy flux will consequently create lateral density gradients
and, hence, lateral pressure gradients in the ocean. A buoyancy-driven exchange
67
Fig. 3.34 Exercise 9. Distributions of Eulerian tracer concentration (color shading) at selected
times of the simulation. Shading refers to a range in concentration between 0 and 1. Lines are
density contours
3.16.5 Additional Exercises for the Reader
Produce a Scilab script that produces a graph of the pathways, called trajectories,
of selected floats. What is the greatest horizontal distance travelled by a float?
3.17 Exercise 10: Slope Convection near the Shore
3.17.1 Background
Under the same heat loss, a smaller volume of fluid cools down at a faster rate than
a larger volume. Therefore, we expect that convection produces the densest water
in the shallowest regions of a coastal ocean. In the presence of variable bathymetry,
a uniform surface buoyancy flux will consequently create lateral density gradients
and, hence, lateral pressure gradients in the ocean. A buoyancy-driven exchange