

3.9 Exercise 5: Internal Waves
47
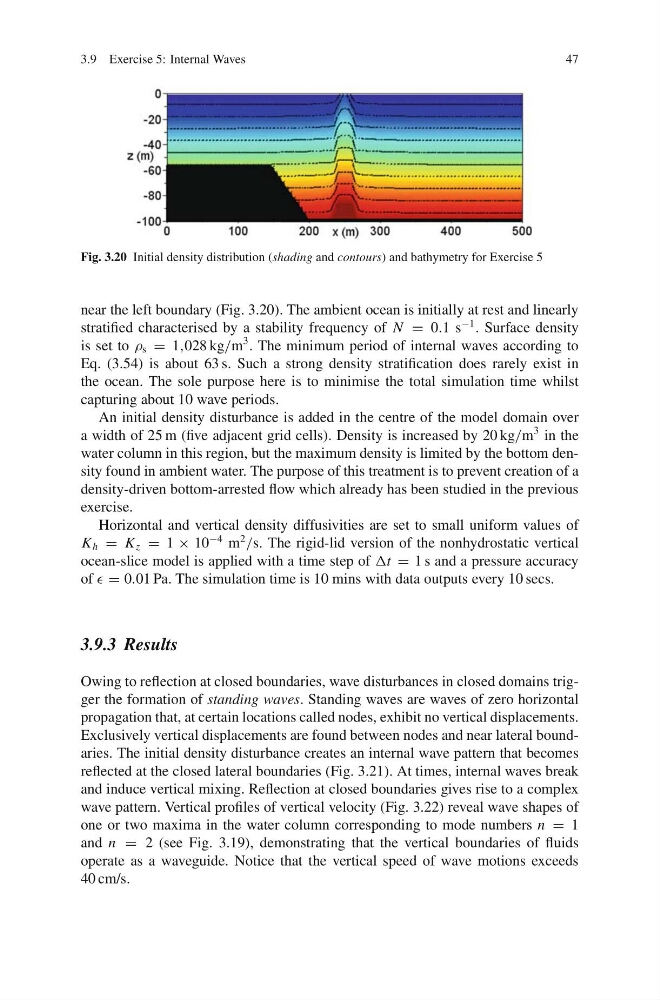
Fig. 3.20 Initial density distribution (shading and contours) and bathymetry for Exercise 5
near the left boundary (Fig. 3.20). The ambient ocean is initially at rest and linearly
stratified characterised by a stability frequency of N = 0.1 s
−1 . Surface density
is set to ρ s = 1,028 kg/m
3 . The minimum period of internal waves according to
Eq. (3.54) is about 63 s. Such a strong density stratification does rarely exist in
the ocean. The sole purpose here is to minimise the total simulation time whilst
capturing about 10 wave periods.
An initial density disturbance is added in the centre of the model domain over
a width of 25 m (five adjacent grid cells). Density is increased by 20 kg/m
3 in the
water column in this region, but the maximum density is limited by the bottom density found in ambient water. The purpose of this treatment is to prevent creation of a
density-driven bottom-arrested flow which already has been studied in the previous
exercise.
Horizontal and vertical density diffusivities are set to small uniform values of
K h = K z = 1 × 10
−4 m
2
/s. The rigid-lid version of the nonhydrostatic vertical
ocean-slice model is applied with a time step of Δt = 1 s and a pressure accuracy
of = 0.01 Pa. The simulation time is 10 mins with data outputs every 10 secs.
3.9.3 Results
Owing to reflection at closed boundaries, wave disturbances in closed domains trigger the formation of standing waves. Standing waves are waves of zero horizontal
propagation that, at certain locations called nodes, exhibit no vertical displacements.
Exclusively vertical displacements are found between nodes and near lateral boundaries. The initial density disturbance creates an internal wave pattern that becomes
reflected at the closed lateral boundaries (Fig. 3.21). At times, internal waves break
and induce vertical mixing. Reflection at closed boundaries gives rise to a complex
wave pattern. Vertical profiles of vertical velocity (Fig. 3.22) reveal wave shapes of
one or two maxima in the water column corresponding to mode numbers n = 1
and n = 2 (see Fig. 3.19), demonstrating that the vertical boundaries of fluids
operate as a waveguide. Notice that the vertical speed of wave motions exceeds
40 cm/s.
47
Fig. 3.20 Initial density distribution (shading and contours) and bathymetry for Exercise 5
near the left boundary (Fig. 3.20). The ambient ocean is initially at rest and linearly
stratified characterised by a stability frequency of N = 0.1 s
−1 . Surface density
is set to ρ s = 1,028 kg/m
3 . The minimum period of internal waves according to
Eq. (3.54) is about 63 s. Such a strong density stratification does rarely exist in
the ocean. The sole purpose here is to minimise the total simulation time whilst
capturing about 10 wave periods.
An initial density disturbance is added in the centre of the model domain over
a width of 25 m (five adjacent grid cells). Density is increased by 20 kg/m
3 in the
water column in this region, but the maximum density is limited by the bottom density found in ambient water. The purpose of this treatment is to prevent creation of a
density-driven bottom-arrested flow which already has been studied in the previous
exercise.
Horizontal and vertical density diffusivities are set to small uniform values of
K h = K z = 1 × 10
−4 m
2
/s. The rigid-lid version of the nonhydrostatic vertical
ocean-slice model is applied with a time step of Δt = 1 s and a pressure accuracy
of = 0.01 Pa. The simulation time is 10 mins with data outputs every 10 secs.
3.9.3 Results
Owing to reflection at closed boundaries, wave disturbances in closed domains trigger the formation of standing waves. Standing waves are waves of zero horizontal
propagation that, at certain locations called nodes, exhibit no vertical displacements.
Exclusively vertical displacements are found between nodes and near lateral boundaries. The initial density disturbance creates an internal wave pattern that becomes
reflected at the closed lateral boundaries (Fig. 3.21). At times, internal waves break
and induce vertical mixing. Reflection at closed boundaries gives rise to a complex
wave pattern. Vertical profiles of vertical velocity (Fig. 3.22) reveal wave shapes of
one or two maxima in the water column corresponding to mode numbers n = 1
and n = 2 (see Fig. 3.19), demonstrating that the vertical boundaries of fluids
operate as a waveguide. Notice that the vertical speed of wave motions exceeds
40 cm/s.