

3.24 Exercise 14: Positive Estuaries
93
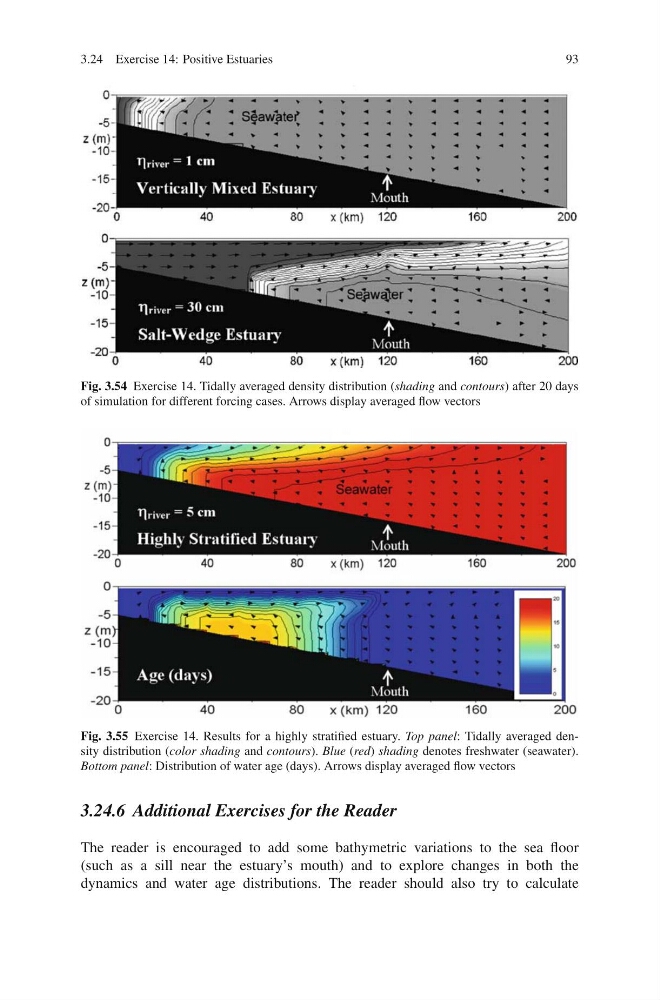
Fig. 3.54 Exercise 14. Tidally averaged density distribution (shading and contours) after 20 days
of simulation for different forcing cases. Arrows display averaged flow vectors
Fig. 3.55 Exercise 14. Results for a highly stratified estuary. Top panel: Tidally averaged density distribution (color shading and contours). Blue (red) shading denotes freshwater (seawater).
Bottom panel: Distribution of water age (days). Arrows display averaged flow vectors
3.24.6 Additional Exercises for the Reader
The reader is encouraged to add some bathymetric variations to the sea floor
(such as a sill near the estuary’s mouth) and to explore changes in both the
dynamics and water age distributions. The reader should also try to calculate
93
Fig. 3.54 Exercise 14. Tidally averaged density distribution (shading and contours) after 20 days
of simulation for different forcing cases. Arrows display averaged flow vectors
Fig. 3.55 Exercise 14. Results for a highly stratified estuary. Top panel: Tidally averaged density distribution (color shading and contours). Blue (red) shading denotes freshwater (seawater).
Bottom panel: Distribution of water age (days). Arrows display averaged flow vectors
3.24.6 Additional Exercises for the Reader
The reader is encouraged to add some bathymetric variations to the sea floor
(such as a sill near the estuary’s mouth) and to explore changes in both the
dynamics and water age distributions. The reader should also try to calculate