

6.15 Exercise 21: Frontal Instability
161
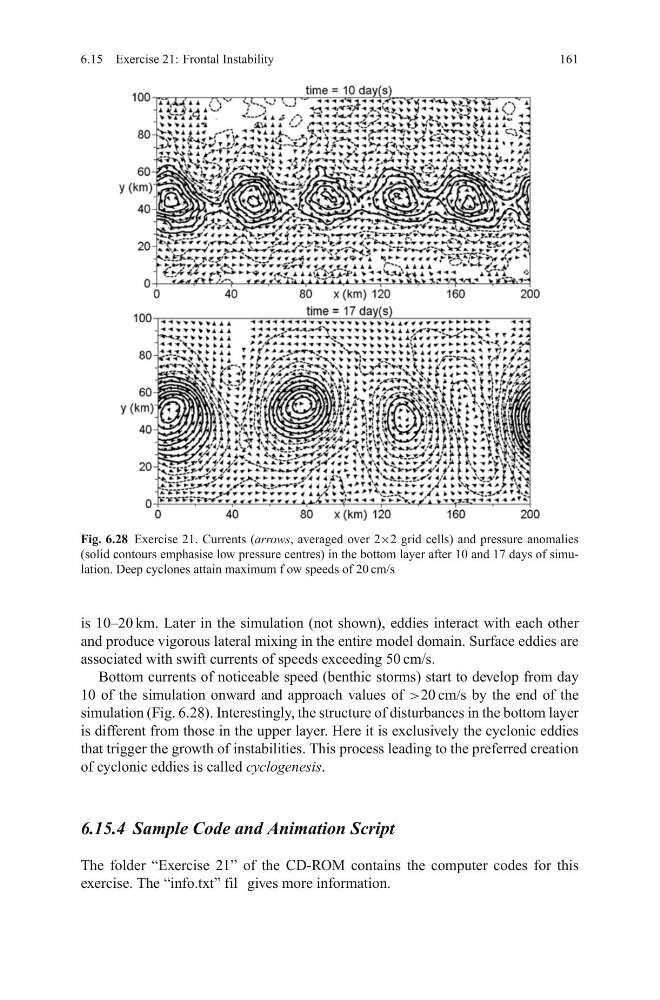
Fig. 6.28 Exercise 21. Currents (arrows, averaged over 2×2 grid cells) and pressure anomalies
(solid contours emphasise low pressure centres) in the bottom layer after 10 and 17 days of simulation. Deep cyclones attain maximum f ow speeds of 20 cm/s
is 10–20 km. Later in the simulation (not shown), eddies interact with each other
and produce vigorous lateral mixing in the entire model domain. Surface eddies are
associated with swift currents of speeds exceeding 50 cm/s.
Bottom currents of noticeable speed (benthic storms) start to develop from day
10 of the simulation onward and approach values of >20 cm/s by the end of the
simulation (Fig. 6.28). Interestingly, the structure of disturbances in the bottom layer
is different from those in the upper layer. Here it is exclusively the cyclonic eddies
that trigger the growth of instabilities. This process leading to the preferred creation
of cyclonic eddies is called cyclogenesis.
6.15.4 Sample Code and Animation Script
The folder “Exercise 21” of the CD-ROM contains the computer codes for this
exercise. The “info.txt” fil gives more information.
161
Fig. 6.28 Exercise 21. Currents (arrows, averaged over 2×2 grid cells) and pressure anomalies
(solid contours emphasise low pressure centres) in the bottom layer after 10 and 17 days of simulation. Deep cyclones attain maximum f ow speeds of 20 cm/s
is 10–20 km. Later in the simulation (not shown), eddies interact with each other
and produce vigorous lateral mixing in the entire model domain. Surface eddies are
associated with swift currents of speeds exceeding 50 cm/s.
Bottom currents of noticeable speed (benthic storms) start to develop from day
10 of the simulation onward and approach values of >20 cm/s by the end of the
simulation (Fig. 6.28). Interestingly, the structure of disturbances in the bottom layer
is different from those in the upper layer. Here it is exclusively the cyclonic eddies
that trigger the growth of instabilities. This process leading to the preferred creation
of cyclonic eddies is called cyclogenesis.
6.15.4 Sample Code and Animation Script
The folder “Exercise 21” of the CD-ROM contains the computer codes for this
exercise. The “info.txt” fil gives more information.