

that something was happening. We had to find out. If it were the case that the site
looked different, then this could mean that the morphological landscape of the
ridge was changing rapidly and the geological time scale, where we were used to
counting in thousands and millions of years, was no longer valid.
Then I decided, along with my scientific colleagues, to make several other dives
to verify if rapid changes in the growth of the hydrothermal edifices were in fact
taking place so quickly. Thus, we sent another dive (CY82-24) with Guy Sciarrone, Pottier and Francis Albarède to continue our systematic geological field
mapping of the spreading axis but at the same time, they were asked to take a
closer look at the particular hydrothermal site the pilot had visited shortly before.
By now, Guy was familiar with the terrain, so after crossing the lava pond
depression, he found the site on the East side of graben axis and he recognized the
active chimney. During his communication to the surface, he told us that,
according to his estimation, the same chimney that he had seen last time had
grown about 20 cm (approximately 1 foot). This was astonishing news, if true.
The Chain site. The most striking experiment carried out during this diving
cruise was the measurement of the growth rate of a hydrothermal chimney. This
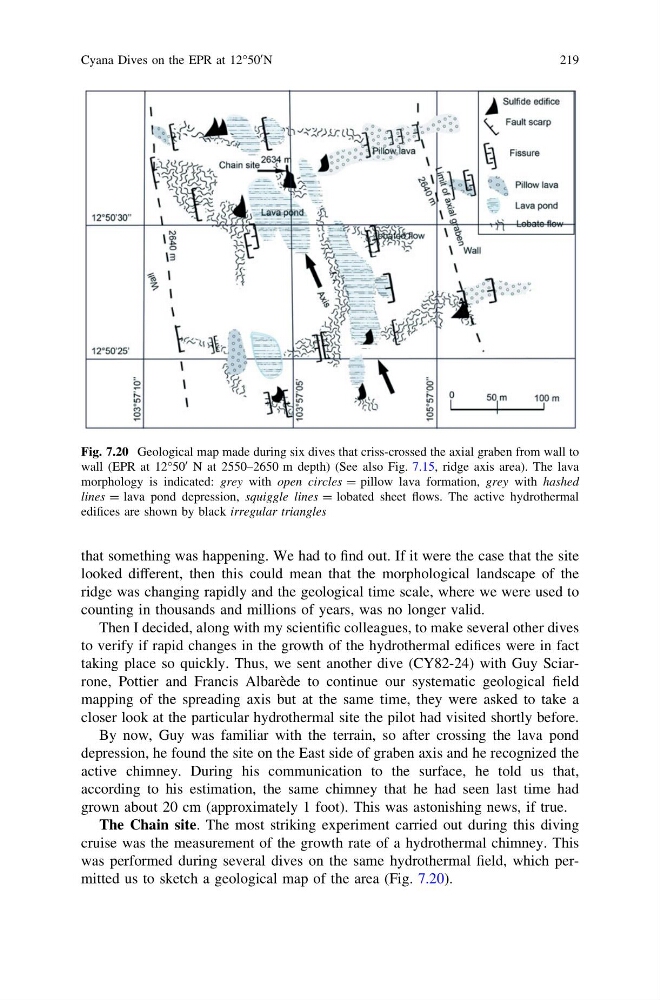
was performed during several dives on the same hydrothermal field, which permitted us to sketch a geological map of the area (Fig. 7.20).
Fig. 7.20 Geological map made during six dives that criss-crossed the axial graben from wall to
wall (EPR at 12°50
0 N at 2550–2650 m depth) (See also Fig. 7.15, ridge axis area). The lava
morphology is indicated: grey with open circles = pillow lava formation, grey with hashed
lines = lava pond depression, squiggle lines = lobated sheet flows. The active hydrothermal
edifices are shown by black irregular triangles
Cyana Dives on the EPR at 12°50
0 N
219
looked different, then this could mean that the morphological landscape of the
ridge was changing rapidly and the geological time scale, where we were used to
counting in thousands and millions of years, was no longer valid.
Then I decided, along with my scientific colleagues, to make several other dives
to verify if rapid changes in the growth of the hydrothermal edifices were in fact
taking place so quickly. Thus, we sent another dive (CY82-24) with Guy Sciarrone, Pottier and Francis Albarède to continue our systematic geological field
mapping of the spreading axis but at the same time, they were asked to take a
closer look at the particular hydrothermal site the pilot had visited shortly before.
By now, Guy was familiar with the terrain, so after crossing the lava pond
depression, he found the site on the East side of graben axis and he recognized the
active chimney. During his communication to the surface, he told us that,
according to his estimation, the same chimney that he had seen last time had
grown about 20 cm (approximately 1 foot). This was astonishing news, if true.
The Chain site. The most striking experiment carried out during this diving
cruise was the measurement of the growth rate of a hydrothermal chimney. This
was performed during several dives on the same hydrothermal field, which permitted us to sketch a geological map of the area (Fig. 7.20).
Fig. 7.20 Geological map made during six dives that criss-crossed the axial graben from wall to
wall (EPR at 12°50
0 N at 2550–2650 m depth) (See also Fig. 7.15, ridge axis area). The lava
morphology is indicated: grey with open circles = pillow lava formation, grey with hashed
lines = lava pond depression, squiggle lines = lobated sheet flows. The active hydrothermal
edifices are shown by black irregular triangles
Cyana Dives on the EPR at 12°50
0 N
219