

19 Forecasting the Coastal Optical Properties Using Satellite Ocean Color
337
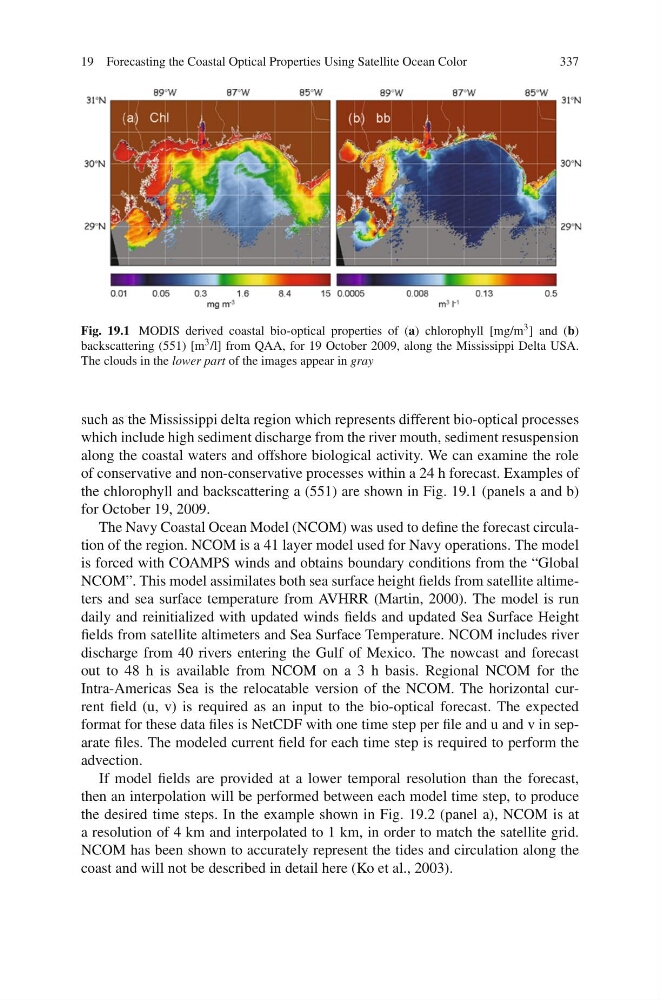
Fig. 19.1 MODIS derived coastal bio-optical properties of (a) chlorophyll [mg/m 3 ] and (b)
backscattering (551) [m 3 /l] from QAA, for 19 October 2009, along the Mississippi Delta USA.
The clouds in the lower part of the images appear in gray
such as the Mississippi delta region which represents different bio-optical processes
which include high sediment discharge from the river mouth, sediment resuspension
along the coastal waters and offshore biological activity. We can examine the role
of conservative and non-conservative processes within a 24 h forecast. Examples of
the chlorophyll and backscattering a (551) are shown in Fig. 19.1 (panels a and b)
for October 19, 2009.
The Navy Coastal Ocean Model (NCOM) was used to define the forecast circulation of the region. NCOM is a 41 layer model used for Navy operations. The model
is forced with COAMPS winds and obtains boundary conditions from the “Global
NCOM”. This model assimilates both sea surface height fields from satellite altimeters and sea surface temperature from AVHRR (Martin, 2000). The model is run
daily and reinitialized with updated winds fields and updated Sea Surface Height
fields from satellite altimeters and Sea Surface Temperature. NCOM includes river
discharge from 40 rivers entering the Gulf of Mexico. The nowcast and forecast
out to 48 h is available from NCOM on a 3 h basis. Regional NCOM for the
Intra-Americas Sea is the relocatable version of the NCOM. The horizontal current field (u, v) is required as an input to the bio-optical forecast. The expected
format for these data files is NetCDF with one time step per file and u and v in separate files. The modeled current field for each time step is required to perform the
advection.
If model fields are provided at a lower temporal resolution than the forecast,
then an interpolation will be performed between each model time step, to produce
the desired time steps. In the example shown in Fig. 19.2 (panel a), NCOM is at
a resolution of 4 km and interpolated to 1 km, in order to match the satellite grid.
NCOM has been shown to accurately represent the tides and circulation along the
coast and will not be described in detail here (Ko et al., 2003).
337
Fig. 19.1 MODIS derived coastal bio-optical properties of (a) chlorophyll [mg/m 3 ] and (b)
backscattering (551) [m 3 /l] from QAA, for 19 October 2009, along the Mississippi Delta USA.
The clouds in the lower part of the images appear in gray
such as the Mississippi delta region which represents different bio-optical processes
which include high sediment discharge from the river mouth, sediment resuspension
along the coastal waters and offshore biological activity. We can examine the role
of conservative and non-conservative processes within a 24 h forecast. Examples of
the chlorophyll and backscattering a (551) are shown in Fig. 19.1 (panels a and b)
for October 19, 2009.
The Navy Coastal Ocean Model (NCOM) was used to define the forecast circulation of the region. NCOM is a 41 layer model used for Navy operations. The model
is forced with COAMPS winds and obtains boundary conditions from the “Global
NCOM”. This model assimilates both sea surface height fields from satellite altimeters and sea surface temperature from AVHRR (Martin, 2000). The model is run
daily and reinitialized with updated winds fields and updated Sea Surface Height
fields from satellite altimeters and Sea Surface Temperature. NCOM includes river
discharge from 40 rivers entering the Gulf of Mexico. The nowcast and forecast
out to 48 h is available from NCOM on a 3 h basis. Regional NCOM for the
Intra-Americas Sea is the relocatable version of the NCOM. The horizontal current field (u, v) is required as an input to the bio-optical forecast. The expected
format for these data files is NetCDF with one time step per file and u and v in separate files. The modeled current field for each time step is required to perform the
advection.
If model fields are provided at a lower temporal resolution than the forecast,
then an interpolation will be performed between each model time step, to produce
the desired time steps. In the example shown in Fig. 19.2 (panel a), NCOM is at
a resolution of 4 km and interpolated to 1 km, in order to match the satellite grid.
NCOM has been shown to accurately represent the tides and circulation along the
coast and will not be described in detail here (Ko et al., 2003).