

1 Oceans from Space, a Once-a-Decade Review of Progress
9
–30
–20
–10
0
10
20
30
40
1992 1994 1996 1998 2000 2002 2004 2006 2008 2010
Start of year
Global sea level (mm)
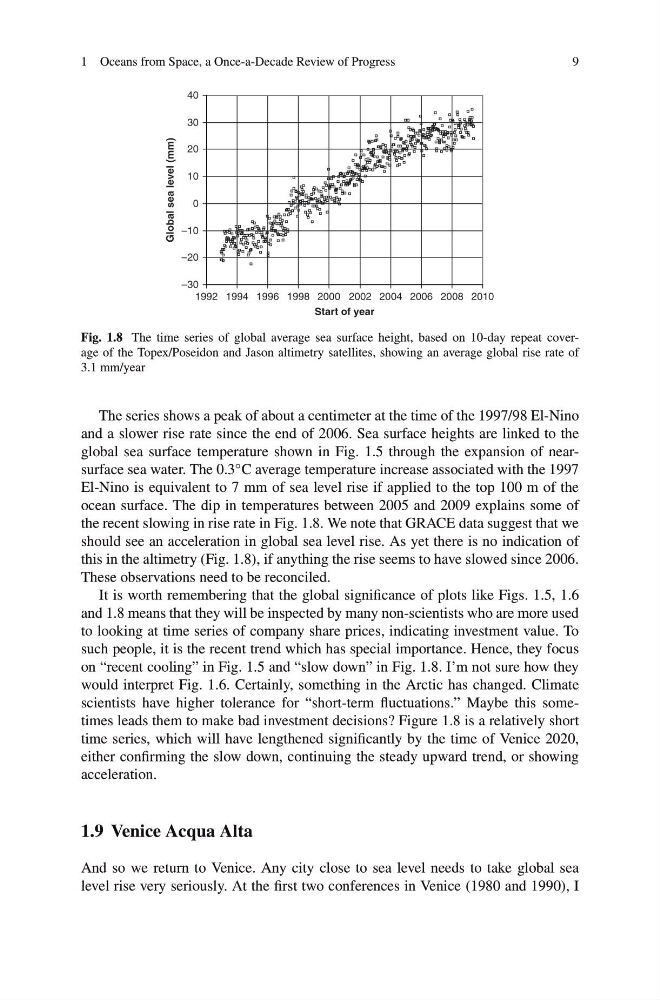
Fig. 1.8 The time series of global average sea surface height, based on 10-day repeat coverage of the Topex/Poseidon and Jason altimetry satellites, showing an average global rise rate of
3.1 mm/year
The series shows a peak of about a centimeter at the time of the 1997/98 El-Nino
and a slower rise rate since the end of 2006. Sea surface heights are linked to the
global sea surface temperature shown in Fig. 1.5 through the expansion of nearsurface sea water. The 0.3 ◦ C average temperature increase associated with the 1997
El-Nino is equivalent to 7 mm of sea level rise if applied to the top 100 m of the
ocean surface. The dip in temperatures between 2005 and 2009 explains some of
the recent slowing in rise rate in Fig. 1.8. We note that GRACE data suggest that we
should see an acceleration in global sea level rise. As yet there is no indication of
this in the altimetry (Fig. 1.8), if anything the rise seems to have slowed since 2006.
These observations need to be reconciled.
It is worth remembering that the global significance of plots like Figs. 1.5, 1.6
and 1.8 means that they will be inspected by many non-scientists who are more used
to looking at time series of company share prices, indicating investment value. To
such people, it is the recent trend which has special importance. Hence, they focus
on “recent cooling” in Fig. 1.5 and “slow down” in Fig. 1.8. I’m not sure how they
would interpret Fig. 1.6. Certainly, something in the Arctic has changed. Climate
scientists have higher tolerance for “short-term fluctuations.” Maybe this sometimes leads them to make bad investment decisions? Figure 1.8 is a relatively short
time series, which will have lengthened significantly by the time of Venice 2020,
either confirming the slow down, continuing the steady upward trend, or showing
acceleration.
1.9 Venice Acqua Alta
And so we return to Venice. Any city close to sea level needs to take global sea
level rise very seriously. At the first two conferences in Venice (1980 and 1990), I
9
–30
–20
–10
0
10
20
30
40
1992 1994 1996 1998 2000 2002 2004 2006 2008 2010
Start of year
Global sea level (mm)
Fig. 1.8 The time series of global average sea surface height, based on 10-day repeat coverage of the Topex/Poseidon and Jason altimetry satellites, showing an average global rise rate of
3.1 mm/year
The series shows a peak of about a centimeter at the time of the 1997/98 El-Nino
and a slower rise rate since the end of 2006. Sea surface heights are linked to the
global sea surface temperature shown in Fig. 1.5 through the expansion of nearsurface sea water. The 0.3 ◦ C average temperature increase associated with the 1997
El-Nino is equivalent to 7 mm of sea level rise if applied to the top 100 m of the
ocean surface. The dip in temperatures between 2005 and 2009 explains some of
the recent slowing in rise rate in Fig. 1.8. We note that GRACE data suggest that we
should see an acceleration in global sea level rise. As yet there is no indication of
this in the altimetry (Fig. 1.8), if anything the rise seems to have slowed since 2006.
These observations need to be reconciled.
It is worth remembering that the global significance of plots like Figs. 1.5, 1.6
and 1.8 means that they will be inspected by many non-scientists who are more used
to looking at time series of company share prices, indicating investment value. To
such people, it is the recent trend which has special importance. Hence, they focus
on “recent cooling” in Fig. 1.5 and “slow down” in Fig. 1.8. I’m not sure how they
would interpret Fig. 1.6. Certainly, something in the Arctic has changed. Climate
scientists have higher tolerance for “short-term fluctuations.” Maybe this sometimes leads them to make bad investment decisions? Figure 1.8 is a relatively short
time series, which will have lengthened significantly by the time of Venice 2020,
either confirming the slow down, continuing the steady upward trend, or showing
acceleration.
1.9 Venice Acqua Alta
And so we return to Venice. Any city close to sea level needs to take global sea
level rise very seriously. At the first two conferences in Venice (1980 and 1990), I