

15 Use of TIR from Space in Operational Systems
253
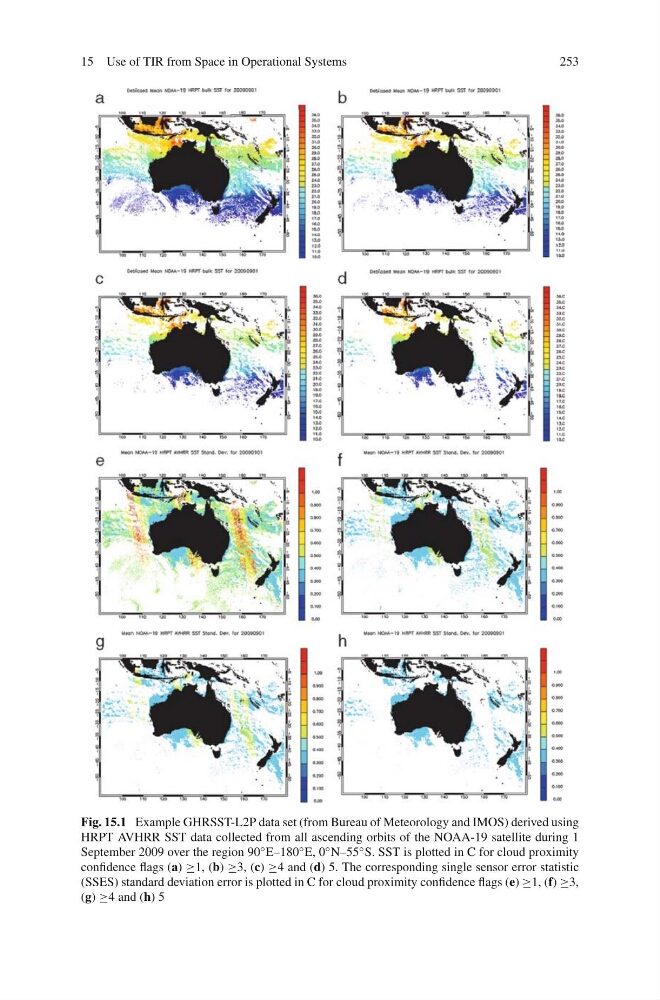
Fig. 15.1 Example GHRSST-L2P data set (from Bureau of Meteorology and IMOS) derived using
HRPT AVHRR SST data collected from all ascending orbits of the NOAA-19 satellite during 1
September 2009 over the region 90 ◦ E–180 ◦ E, 0 ◦ N–55 ◦ S. SST is plotted in C for cloud proximity
confidence flags (a) ≥1, (b) ≥3, (c) ≥4 and (d) 5. The corresponding single sensor error statistic
(SSES) standard deviation error is plotted in C for cloud proximity confidence flags (e) ≥1, (f) ≥3,
(g) ≥4 and (h) 5
253
Fig. 15.1 Example GHRSST-L2P data set (from Bureau of Meteorology and IMOS) derived using
HRPT AVHRR SST data collected from all ascending orbits of the NOAA-19 satellite during 1
September 2009 over the region 90 ◦ E–180 ◦ E, 0 ◦ N–55 ◦ S. SST is plotted in C for cloud proximity
confidence flags (a) ≥1, (b) ≥3, (c) ≥4 and (d) 5. The corresponding single sensor error statistic
(SSES) standard deviation error is plotted in C for cloud proximity confidence flags (e) ≥1, (f) ≥3,
(g) ≥4 and (h) 5