

1 Oceans from Space, a Once-a-Decade Review of Progress
7
–3
–2.5
–2
–1.5
–1
–0.5
0
0.5
1
1975
1980
1 9 85
1990
1995
2000
2005
2010
Start of year
Area (Millions of km
2
)
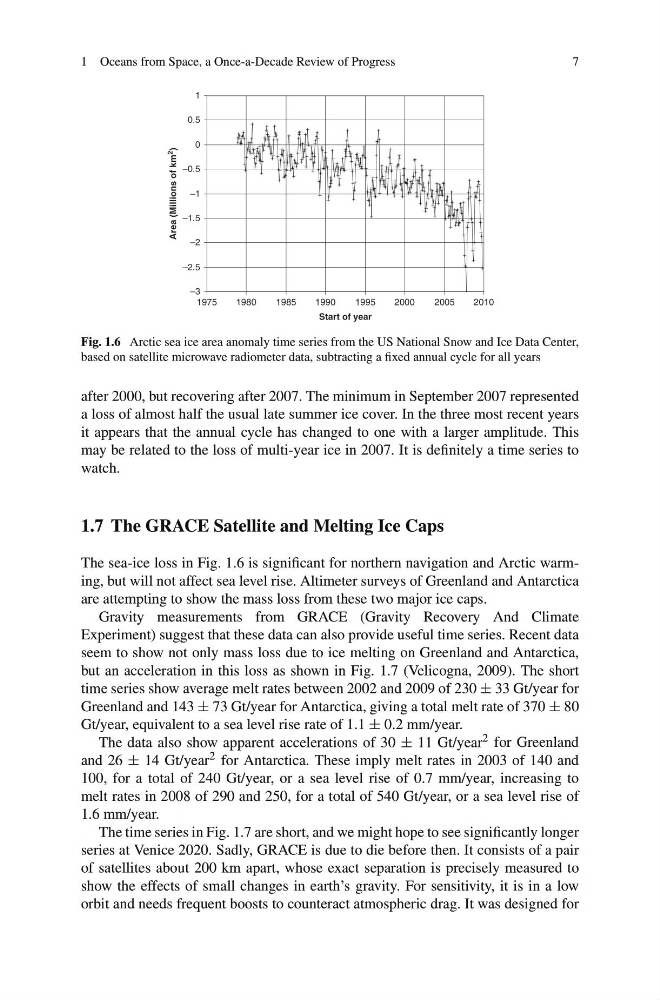
Fig. 1.6 Arctic sea ice area anomaly time series from the US National Snow and Ice Data Center,
based on satellite microwave radiometer data, subtracting a fixed annual cycle for all years
after 2000, but recovering after 2007. The minimum in September 2007 represented
a loss of almost half the usual late summer ice cover. In the three most recent years
it appears that the annual cycle has changed to one with a larger amplitude. This
may be related to the loss of multi-year ice in 2007. It is definitely a time series to
watch.
1.7 The GRACE Satellite and Melting Ice Caps
The sea-ice loss in Fig. 1.6 is significant for northern navigation and Arctic warming, but will not affect sea level rise. Altimeter surveys of Greenland and Antarctica
are attempting to show the mass loss from these two major ice caps.
Gravity measurements from GRACE (Gravity Recovery And Climate
Experiment) suggest that these data can also provide useful time series. Recent data
seem to show not only mass loss due to ice melting on Greenland and Antarctica,
but an acceleration in this loss as shown in Fig. 1.7 (Velicogna, 2009). The short
time series show average melt rates between 2002 and 2009 of 230 ± 33 Gt/year for
Greenland and 143 ± 73 Gt/year for Antarctica, giving a total melt rate of 370 ± 80
Gt/year, equivalent to a sea level rise rate of 1.1 ± 0.2 mm/year.
The data also show apparent accelerations of 30 ± 11 Gt/year 2 for Greenland
and 26 ± 14 Gt/year 2 for Antarctica. These imply melt rates in 2003 of 140 and
100, for a total of 240 Gt/year, or a sea level rise of 0.7 mm/year, increasing to
melt rates in 2008 of 290 and 250, for a total of 540 Gt/year, or a sea level rise of
1.6 mm/year.
The time series in Fig. 1.7 are short, and we might hope to see significantly longer
series at Venice 2020. Sadly, GRACE is due to die before then. It consists of a pair
of satellites about 200 km apart, whose exact separation is precisely measured to
show the effects of small changes in earth’s gravity. For sensitivity, it is in a low
orbit and needs frequent boosts to counteract atmospheric drag. It was designed for
7
–3
–2.5
–2
–1.5
–1
–0.5
0
0.5
1
1975
1980
1 9 85
1990
1995
2000
2005
2010
Start of year
Area (Millions of km
2
)
Fig. 1.6 Arctic sea ice area anomaly time series from the US National Snow and Ice Data Center,
based on satellite microwave radiometer data, subtracting a fixed annual cycle for all years
after 2000, but recovering after 2007. The minimum in September 2007 represented
a loss of almost half the usual late summer ice cover. In the three most recent years
it appears that the annual cycle has changed to one with a larger amplitude. This
may be related to the loss of multi-year ice in 2007. It is definitely a time series to
watch.
1.7 The GRACE Satellite and Melting Ice Caps
The sea-ice loss in Fig. 1.6 is significant for northern navigation and Arctic warming, but will not affect sea level rise. Altimeter surveys of Greenland and Antarctica
are attempting to show the mass loss from these two major ice caps.
Gravity measurements from GRACE (Gravity Recovery And Climate
Experiment) suggest that these data can also provide useful time series. Recent data
seem to show not only mass loss due to ice melting on Greenland and Antarctica,
but an acceleration in this loss as shown in Fig. 1.7 (Velicogna, 2009). The short
time series show average melt rates between 2002 and 2009 of 230 ± 33 Gt/year for
Greenland and 143 ± 73 Gt/year for Antarctica, giving a total melt rate of 370 ± 80
Gt/year, equivalent to a sea level rise rate of 1.1 ± 0.2 mm/year.
The data also show apparent accelerations of 30 ± 11 Gt/year 2 for Greenland
and 26 ± 14 Gt/year 2 for Antarctica. These imply melt rates in 2003 of 140 and
100, for a total of 240 Gt/year, or a sea level rise of 0.7 mm/year, increasing to
melt rates in 2008 of 290 and 250, for a total of 540 Gt/year, or a sea level rise of
1.6 mm/year.
The time series in Fig. 1.7 are short, and we might hope to see significantly longer
series at Venice 2020. Sadly, GRACE is due to die before then. It consists of a pair
of satellites about 200 km apart, whose exact separation is precisely measured to
show the effects of small changes in earth’s gravity. For sensitivity, it is in a low
orbit and needs frequent boosts to counteract atmospheric drag. It was designed for