

198
P. Cipollini et al.
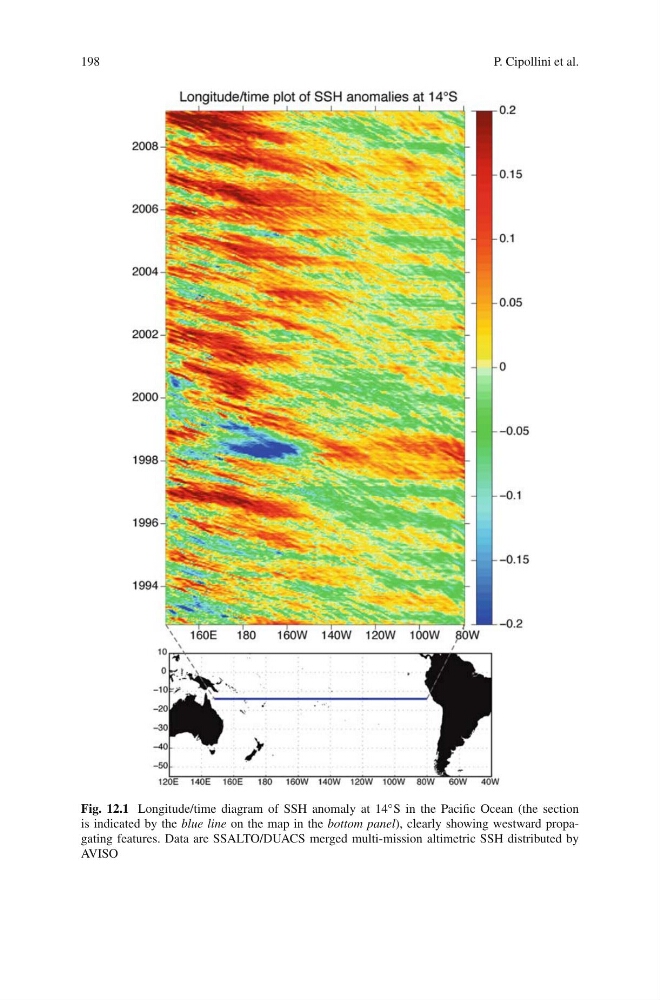
Fig. 12.1 Longitude/time diagram of SSH anomaly at 14 ◦ S in the Pacific Ocean (the section
is indicated by the blue line on the map in the bottom panel), clearly showing westward propagating features. Data are SSALTO/DUACS merged multi-mission altimetric SSH distributed by
AVISO
P. Cipollini et al.
Fig. 12.1 Longitude/time diagram of SSH anomaly at 14 ◦ S in the Pacific Ocean (the section
is indicated by the blue line on the map in the bottom panel), clearly showing westward propagating features. Data are SSALTO/DUACS merged multi-mission altimetric SSH distributed by
AVISO